Curated OER
Hand Span and Height
Is there a relationship between hand span width and height? Statisticians survey each other by taking measurements of both. A table that can hold data for 24 individuals is printed onto the worksheet, along with questions for analysis....
Curated OER
Influence and Outliers
Using the TI-Nspire calculator, statisicians identify outliers and their effect on the least-squares regression line. In finding the line of best fit, they determine what points will affect the least squares regressions and what points...
Curated OER
Statistics Canada
Students practice using graphing tools to make tables, bar charts, scatter graphs, and histograms, using census data. They apply the concept of measures of central tendency, examine the effects of outliers. They also write inferences and...
Curated OER
Statistics: Standard Deviation and Outliers
For this statistics worksheet, statisticians construct a stem-plot and answer questions regarding the shape of the distribution, standard deviation, and outliers.
Curated OER
Mean, Median, Mode, Range
Learners engage in a study of mean, median, mode, and range in order to represent data in tables. They are also exposed to the results of data that is skewed because of the outlier.
Curated OER
Mean / Average
In this mean/average worksheet, learners find the mean in three ways: one, by redrawing the objects in a set to show the mean, two, by adding the numbers and dividing by how many numbers there are and three, by finding the mean with or...
Curated OER
Data Management and Probability: Applications
In this data management and probability applications worksheet, 8th graders solve 20 various types of probability problems. They find the mean, median, mode and range of various numbers. Then, students use the spinner illustration to...
Curated OER
Line Plots
In this line plot worksheet, students create a line plot of given data. They identify the range, clusters, gaps, and outliers. This one-page worksheet contains 8 multi-step problems.
Curated OER
Is There A Formula for People?
Students explore proportions which are typical of the human body. Given a list of classic proportions from earlier centuries, students work in pairs to test the validity of the proportions. Pupils share their personal measurements. ...
National Institute of Standards and Technology (NIST)
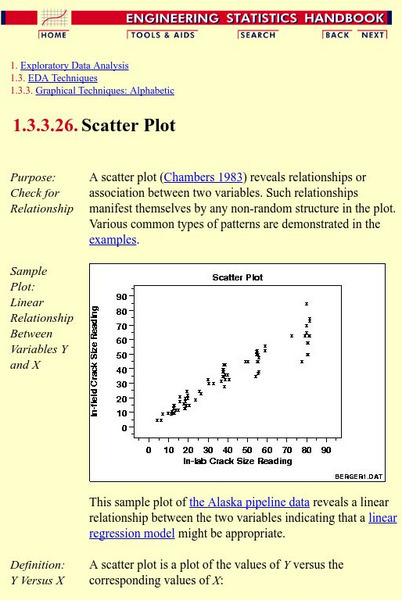
Nist: Engineering Statistics Handbook: Scatter Plots and Linear Regression
An explanation of scatter plots followed by examples of the many different kinds of scatter plots.
University of Georgia
University of Georgia: Measures of Variation
Lesson plan introduces and explains how to calculate measures of variation concepts such as range and quartile.
CK-12 Foundation
Ck 12: Statistics: Applications of Box and Whisker Plots Grade 8
[Free Registration/Login may be required to access all resource tools.] Using box-and-whisker plots to understand and interpret data.
Beacon Learning Center
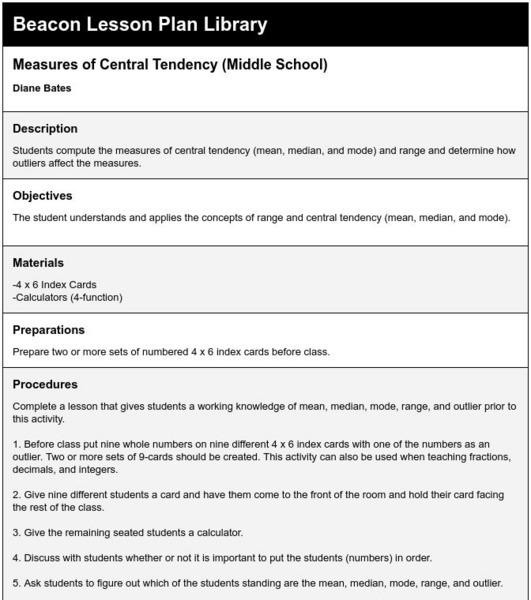
Beacon Learning Center: Measures of Central Tendency (Middle School)
Lesson plan provides practice for calculating measures of center.
Science Education Resource Center at Carleton College
Serc: Using Your Hair to Understand Descriptive Statistics
Enhance learners' understanding of various descriptive measures with a visual interpretation of a mean, median, outlier, and the concept of distance-to-mean.


