Curated OER
Creating and Analyzing Graphs of Tropospheric Ozone
Students create and analyze graphs using archived atmospheric data to compare the ozone levels of selected regions around the world.
Curated OER
Smog City - Part II
Students create an experiment about ozone levels using a Smog City Simulation on the Internet. They complete a worksheet and study associated vocabulary.
Curated OER
Smog City - Part I
Young scholars apply an interactive smog visualization application, Smog City to see how ozone levels are related to population levels and emissions. They study associated vocabulary and complete a worksheet.
Other
Simple Science: Hole in the Sky
Learners explore images of atmospheric ozone levels over the South Pole. The resource has students determine the months of lowest ozone levels and changes in ozone levels since 1979. The activity has an interactive online version and a...
Center for Innovation in Engineering and Science Education, Stevens Institute of Technology
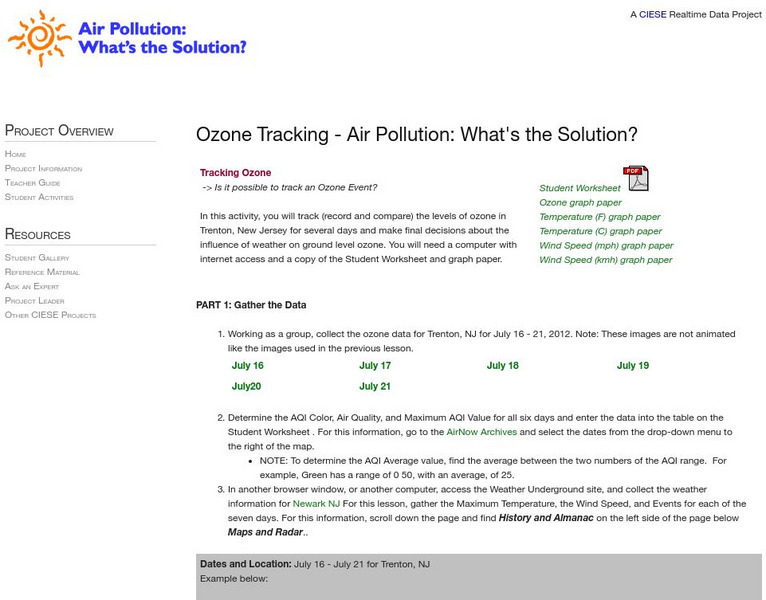
Ciese Real Time Data Projects: Air Pollution: Tracking Ozone
In this activity, you will monitor the levels of ozone in Trenton, New Jersey for several days and make final decisions about the influence of weather on ground level ozone.
University Corporation for Atmospheric Research
Ucar: Ozone Attack
In this activity, students observe how rubber bands deteriorate, developing cracks or pits, in locations with different ozone levels.
University Corporation for Atmospheric Research
Ucar: Ozone in Our Neighborhood
Young scholars will experiment to understand variations in the amount of ground-level ozone between different places in their neighborhood, town, or city.


