Beacon Learning Center
Beacon Learning Center: Piece of Pie
This is a tutorial for creating and practice interpreting pie charts. They use the example of number of people in each of 24 families to demonstrate how the pieces of pie are created. Then questions were asked and students input the...
McGraw Hill
Glencoe: Self Check Quizzes 2 Circle Graphs
Use Glencoe's Math Course 2 randomly generated self-checking quiz to test your knowledge of circle graphs. Each question has a "Hint" link to help. Choose the correct answer for each problem. At the bottom of the page click the "Check...
McGraw Hill
Glencoe: Self Check Quizzes 1 Circle Graphs
Use Glencoe's randomly generated self-checking quiz to test your knowledge of circle graphs. Each question has a "Hint" link to help. Choose the correct answer for each problem. At the bottom of the page click the "Check It" button and...
Teachnology
Teachnology: Survey Teaching Theme
Survey Theme provides an excellent collection of free sample worksheets, teacher resources, lesson plans and interactive media for grades k-12.
Teachnology
Teachnology: Survey Teaching Theme
Survey Theme provides an excellent collection of free sample worksheets, teacher resources, lesson plans and interactive media for grades k-12.
Other
Online Statistics Education: Graphing Distributions [Pdf]
This is the second chapter of a statistics e-text developed collaboratively by Rice University, University of Houston Clear Lake, and Tufts University. It looks at many different types of data displays and the advantages and...
US Department of Education
National Center for Education Statistics: Create a Graph Tutorial
This tutorial walks students through how to create different types of graphs using the Create a Graph tool available on the website. Covers bar graphs, line graphs, pie charts, area graphs, scatter plots, and dependent and independent...
Texas Education Agency
Texas Gateway: Evaluate Graphics in Informational/procedural Text
[Accessible by TX Educators. Free Registration/Login Required] In this lesson, you will learn to explain the function of the graphical components. You will also learn to evaluate graphics on how well they do what they are intended to do.
PBS
Pbs Learning Media: When Does 50 50 Become 50 50?
In this video segment from Cyberchase, Bianca goes on a quest to find out if a coin toss really is a 50-50 proposition.
Better Lesson
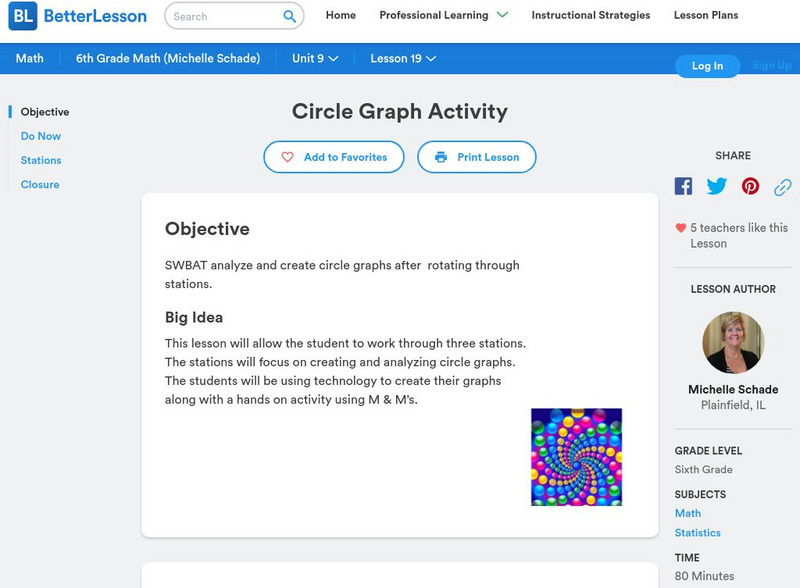
Better Lesson: Circle Graph Activity
This lesson will allow the student to work through three stations. The stations will focus on creating and analyzing circle graphs. The students will be using technology to create their graphs along with a hands-on activity using M&M's.
Other
Delta State University: Lesson Plan 3: Pie Graphs
The students will gather, organize, and display data in an appropriate pie (circle) graph using M&M's! [PDF]
Cuemath
Cuemath: Pie Charts
A comprehensive guide for learning all about pie charts with definitions, solved examples, and practice questions.
Shodor Education Foundation
Shodor Interactivate: Circle Graph
This site shows how to set up your own pie chart for papers and projects. Very colorful and it is free.
Shodor Education Foundation
Shodor Interactivate: Pie Chart
Students investigate how a pie chart can be used to display data graphically. The resource includes the activity and instructor resources.
Texas Instruments
Texas Instruments: Exploring Probability
In this activity, students learn to create a categorical list, then convert their data into a pie chart, and use it to answer questions.
Texas Instruments
Texas Instruments: Mc Dougal Littell Middle School Math: Making Data Displays
Students will create data displays using a scatter plot and a line graph of the data and a circle graph of survey data.
The Franklin Institute
Frankin Institute Online: Group Graphing
This site from The Franklin Institute explores how to make a simple graph using a spreadsheet to portray survey data. It also gives a set of interesting sports-related web sites so that students can get statistical inforamtion.
TeacherLED
Teacher Led Interactive Whiteboard Resource Survey
Students can explore surveys, pie charts, and bar graphs with this interactive white board resource.
CK-12 Foundation
Ck 12: Statistics: Pie Charts Grades 9 10
[Free Registration/Login may be required to access all resource tools.] Covers representing data in a pie chart.
CK-12 Foundation
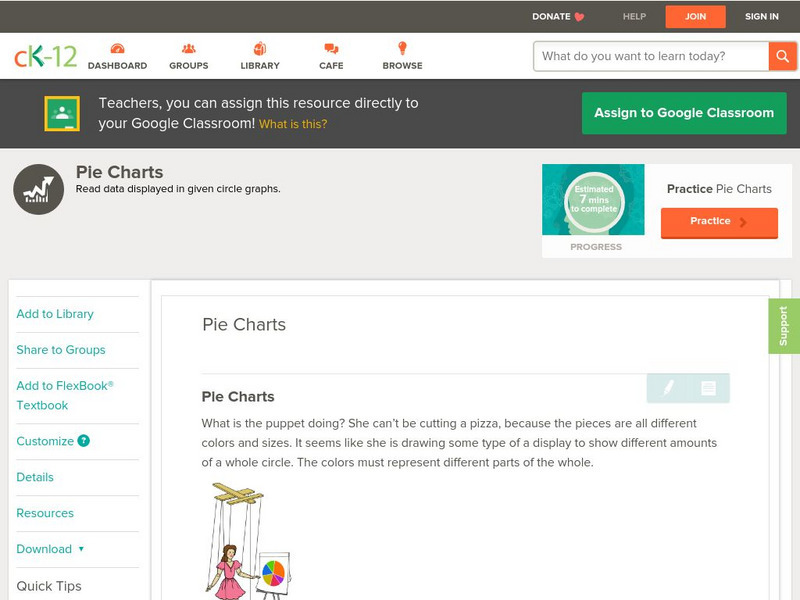
Ck 12: Statistics: Pie Charts Grade 6
[Free Registration/Login may be required to access all resource tools.] Interpret circle graphs and make predictions based on the displayed data.
Math Is Fun
Math Is Fun: Data Graphs
Create and customize a bar graph, line graph, or pie chart based on a set of data and print it out.
Math Is Fun
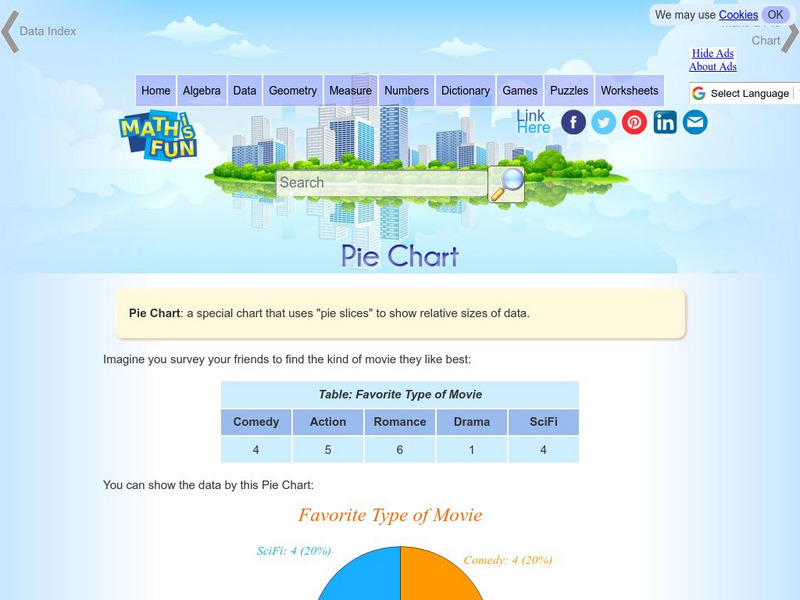
Math Is Fun: Pie Chart
Explains, with examples, what a pie chart is and how to make one. Includes a set of practice questions.
Sophia Learning
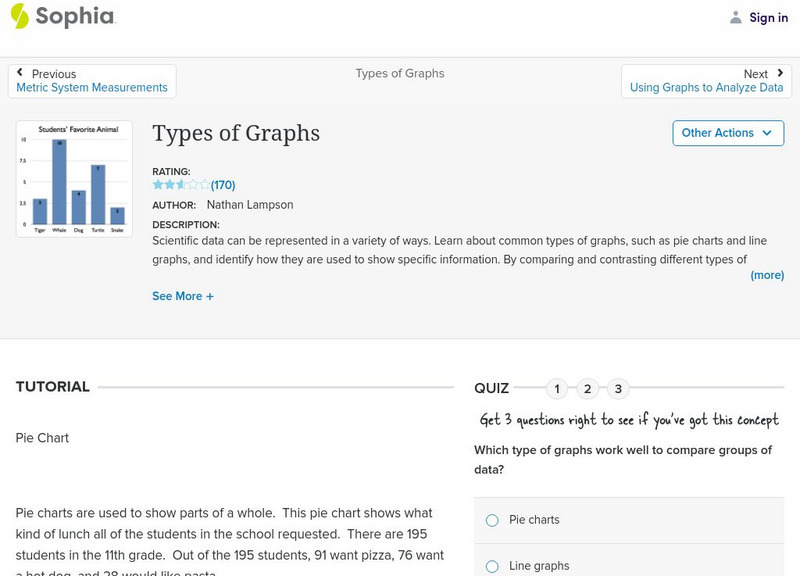
Sophia: Types of Graphs
This presentation allows the learner to visualize the different types of graphs used to display data in scientific investigations.
Colorado State University
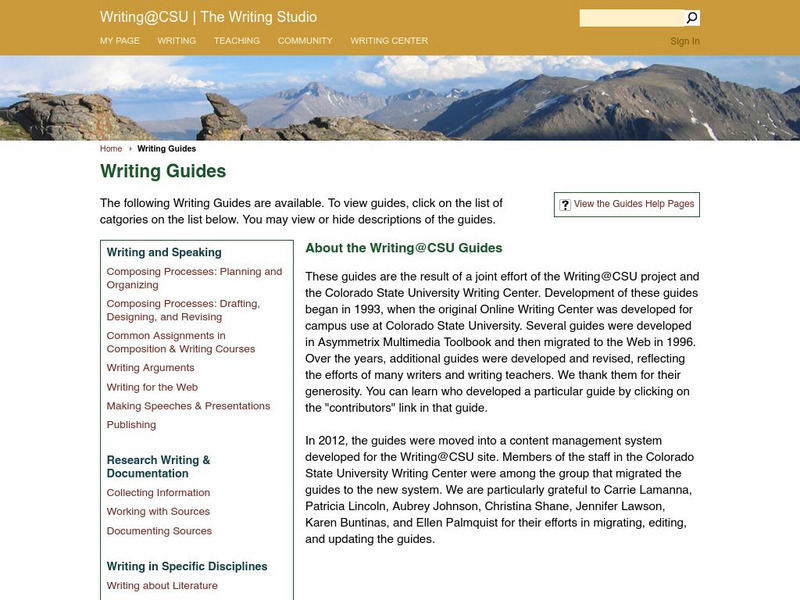
Colorado State Writing Center: Charts
The use of charts and graphs can improve your presentations, whether on paper or as visual aids. Here you can read about how to create line, column, bar, pie graphs, and scatterplots. Just follow the links to their respective pages.


![Online Statistics Education: Graphing Distributions [Pdf] eBook Online Statistics Education: Graphing Distributions [Pdf] eBook](https://d15y2dacu3jp90.cloudfront.net/images/attachment_defaults/resource/large/FPO-knovation.png)


