Khan Academy
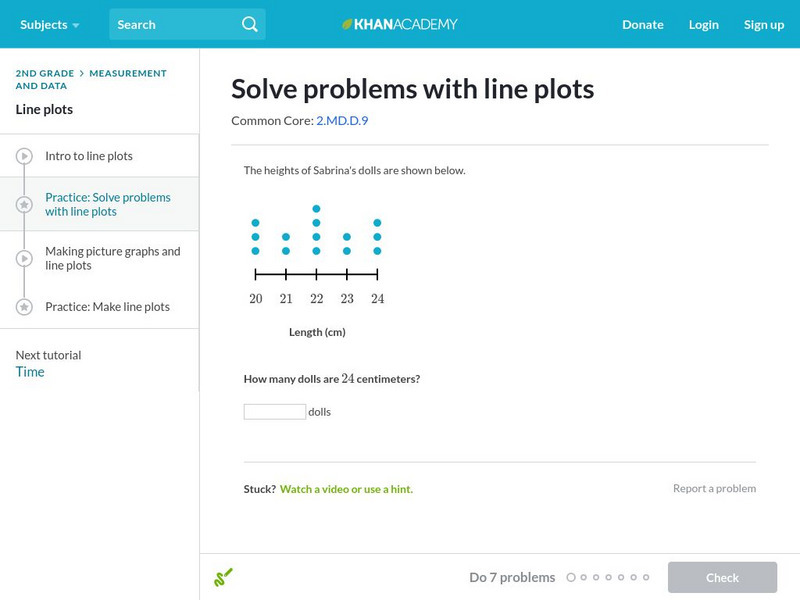
Khan Academy: Solve Problems With Line Plots
Answer questions using line plots and data sets. Students receive immediate feedback and have the opportunity to try questions repeatedly, watch a tutorial video, or receive hints.
Khan Academy
Khan Academy: Practice: Make Line Plots
A practice quiz where students construct line plots using the information given in the problems. Includes hints.
CK-12 Foundation
Ck 12: Types of Data Representation: Graphic Displays of Data
[Free Registration/Login may be required to access all resource tools.] Here you will explore displays of data using bar charts, histograms, pie charts and boxplots, and learn about the differences and similarities between them and how...
Illustrative Mathematics
Illustrative Mathematics: 4.md, 5.md Button Diameters
The purpose of this task is for students to measure lengths to the nearest eighth and quarter-inch and to record that information in a line plot. Aligns with 4.MD.B.4 and CCSS.Math.Content.3.MD.B.4 Generate measurement data by measuring...
Khan Academy
Khan Academy: Interpret Dot Plots With Fraction Operations
Interpret fraction data on dot plots to solve word problems. Students receive immediate feedback and have the opportunity to try questions repeatedly, watch a video or receive hints.
Khan Academy
Khan Academy: Interpret Dot Plots With Fractions 1
Create and interpret dot plots using data with fractions. Fraction operations include addition and subtraction. Students receive immediate feedback and have the opportunity to try questions repeatedly, watch a video or receive hints.
Khan Academy
Khan Academy: Graph Data on Line Plots
Record measurements on line plots (also called dot plots). Students receive immediate feedback and have the opportunity to try questions repeatedly, watch a video or receive hints.
Khan Academy
Khan Academy: Line Plots Review
Reviews what line plots are and how to make them. Includes some practice problems with explanations of the solutions.
Khan Academy
Khan Academy: Read Line Plots (Data With Fractions)
Practice reading and interpreting data that is graphed on line plots. The data graphed includes fractions. Students receive immediate feedback and have the opportunity to try questions repeatedly, watch a video or receive hints....
CK-12 Foundation
Ck 12: Statistics: Displaying Bivariate Data
[Free Registration/Login may be required to access all resource tools.] This Concept shows students how to display bivariate data using scatter plots and line plots.
Alabama Learning Exchange
Alex: There's Perimeter in the School!
Young scholars will work in groups to measure the perimeter of items around the school. They will record their data on a spreadsheet in the form of a line plot.
Alabama Learning Exchange
Alex: Count Your Raisins
In this instructional activity students will create a class line plot using data collected from boxes of raisins. This activity will be used to collect, organize, represent, and describe data using the line plot.
Better Lesson
Better Lesson: Line Plot Activity
This lesson will tap into US History and the ages of presidents during their inauguration and describing the data in a line plot.
Better Lesson
Better Lesson: What Angles Are on a Bat House?
Third graders are preparing to build bat houses. They have calculated surface area, identified nail placement, and will now collect data on angle types in this real-world activity.
Better Lesson
Better Lesson: Sets of Things
Multiplication sounds cool to second graders, but we have to know what it is first. Creating and counting sets is one way to get there.
Quia
Ixl Learning: Dot Plots
Brush up on your math skills relating to dot plots then try some practice problems to test your understanding.
Quia
Ixl Learning: Line Plots
Brush up on your math skills relating to line plots then try some practice problems to test your understanding.
Louisiana Department of Education
Louisiana Doe: Louisiana Believes: Eureka Math Parent Guide: Collecting and Displaying Data
A guide to support parents as they work with their students in collecting and displaying data.
Louisiana Department of Education
Louisiana Doe: Louisiana Believes: Eureka Math Parent Guide: Fraction Equivalence, Ordering, and Operations
A guide to support parents as they work with their students in fraction equivalence, ordering, and operations.
Louisiana Department of Education
Louisiana Doe: Louisiana Believes: Eureka Math Parent Guide: Problem Solving With Length, Money, and Data
A guide to support parents as they work with their students with problem solving with length, money, and data.
McGraw Hill
Glencoe: Using Graphs to Understand Data Quiz
This is a quiz with five quick questions to check your knowledge of how to use graphs to understand data. It is self-checking.
Varsity Tutors
Varsity Tutors: Hotmath: Practice Problems: Tables and Graphs
Six problems present various aspects of using and making tables and graphs to display statistics. They are given with each step to the solution cleverly revealed one at a time. You can work each step of the problem then click the "View...
McGraw Hill
Glencoe: Interpreting Data Quiz
This is a quiz with five quick questions to check your understanding of how to interpret data. It is self checking.


