Curated OER
Human Population- Changes in Survival Rates Data Interpretation
In this human population changes in survival worksheet, students interpret and plot data to understand the differences in human mortality and survivorship between historic and modern times. They investigate how these changes influence...
Curated OER
Graphs and Data
Students investigate poverty using graphs. In this algebra lesson, students collect data on the effects of poverty and use different rules to analyze the data. They graph and use the trapezoid rule to interpret the data.
Curated OER
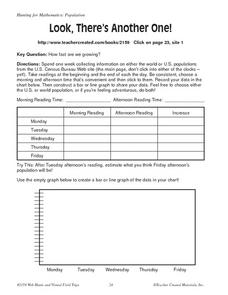
Look, There's Another One!
In this math worksheet, students spend a week collecting information on either the word or U.S. populations from the U.S. Census Bureau Web site. Students record their data in a chart and bar graph. Students also use the website to...
Curated OER
Where Should We Put a Store?
Students analyze population data. They convert population data into simple density maps to help make decisions about their world. They select the best location for a school store based on population density. They present their maps...
Curated OER
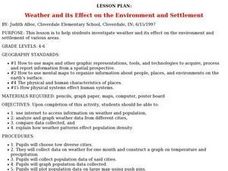
Weather and its Effect on the Environment and Settlement
Students, after choosing two diverse cities, collect data on weather for a month and construct a graph on temperature and precipitation. After collecting population data of said cities, and graphing it, they plot population on a large...


