Texas Instruments
Is It or Isn't It Proportional
How can you tell if number relationships are proportional? Mathematicians investigate proportional relationships. They compare and contrast functions and graphs to determine the characteristics of proportional relationships, as well as...
Illustrative Mathematics
Ratio of Boys to Girls
How many boys are in the class? Here is an introductory exercise describing ratios. The commentary shows different ways learners can approach the problem, using a tape diagram of boys to girls and using a table. The activity includes...
Illustrative Mathematics
Gotham City Taxis
Taxi! Have your travelers figure out how far they can go in a taxi for $10.00. They must account for the mileage rate and tip in their calculation. They can set up a table or make an equation to solve for the exact mileage they can...
Illustrative Mathematics
Peaches and Plums
According to the resource graph, which costs more: peaches or plums? Algebra learners compare two proportional relationships and then throw in a banana. Leaving out the scale helps students become intuitive about graphing.
Illustrative Mathematics
Walk-a-thon 2
During a walk-a-thon your learners must determine the walking rate of Julianna's progress. Using tables, graphs, and an equation, they must be able to calculate the time it took her to walk one mile and predict her distance based on the...
Illustrative Mathematics
Two-School Dance
Who's ready for the dance? When two middle schools combine for a dance, your learners' job is to calculate the ratio of girls attending. Provided with three different solutions, you can choose from setting up a ratio, linear equation, or...
Illustrative Mathematics
Security Camera
A different-than-normal problem that allows learners to practice their reasoning to find an answer. The problem bases itself off a graph drawing of a store that needs to install security cameras. The challenge is to find which placement...
Illustrative Mathematics
Find the Change
This exercise is an opportunity for algebra learners to understand the connection between the slope of a line and points found on the line. Use similar triangles to explain why slope m is the same between any two points. Discuss with the...
Illustrative Mathematics
DVD Profits, Variation 1
The idea in the resource is to understand the connections between proportional relationships, lines, and linear equations. To stay within the context of the standard, skip the part of the resource that solves with unit rates. Instead,...
Illustrative Mathematics
Proportional Relationships, Lines, and Linear Equations
The resource is a good introduction to what makes a proportional relationship between two lines. Discuss the similarities of both lines and the possibility of intersection. Use this opportunity to list other acceptable forms of each...
Illustrative Mathematics
Comparing Speeds in Graphs and Equations
Compare two different proportional relationships on a graph. It is up to your mathematicians to determine which of two moving objects have greater speed. A good example of a Common Core multiple choice question.
Illustrative Mathematics
Coffee by the Pound
This is a great exercise in graphing proportional quantities to interpret the unit rate as the slope of a graph. It is not easy for learners to understand what a unit rate is. When it is presented as the slope of a linear line graph,...
Illustrative Mathematics
Who Has the Best Job?
Making money is important to teenagers. It is up to your apprentices to determine how much two wage earners make with their after school jobs. Participants work with a table, an equation, and a graph and compare the two workers to see...
Illustrative Mathematics
Sale!
Everyone loves a sale, and this worksheet allows learners to calculate which sale is more rewarding. The activity can be adapted for different thinking contexts. The answer key describes different answer choices, some being higher...
Illustrative Mathematics
Buying Protein Bars and Magazines
Packing for a trip? This activity allows learners to decide how many magazines and protein bars they can buy with twenty dollars. They can organize their work in a chart to track how many items they can purchase. There are two different...
Neufeld Learning Systems
Concept: Ratios and Proportions
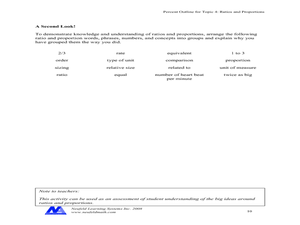
Upper elementary and middle school pupils fill out a chart creating six equivalent fractions and then compare them to six different objects and/or shapes. They group together 16 various terms related to ratios and proportions. Pupils...
Illustrative Mathematics
Friends Meeting on Bikes
It is the job of your mathematicians to figure out how fast Anya is riding her bike when meeting her friend. The problem shares the distance, time spent riding, and Taylor's speed leaving the last variable for your learners to solve. Use...
Illustrative Mathematics
Finding a 10% increase
A quick problem to test your mathematicians' knowledge on percent increase. Two different solutions are provided, mental math and computing. Ask your learners to include a description of what they did to supplement their answer.
Illustrative Mathematics
Tax and Tip
Finding out how to calculate tax and tip is a valuable skill that all young adults should be able to do without a calculator. Learners are given a bill and asked to calculate the tax, tip, and total amount. Calculations can be exact or...
Curated OER
What's Your Shoe Size? Linear Regression with MS Excel
Learners collect and analyze data. For this statistics lesson, pupils create a liner model of their data and analyze it using central tendencies. They find the linear regression using a spreadsheet.
Utah Education Network (UEN)
Linear Relationships: Tables, Equations, and Graphs
Pupils explore the concept of linear relationships. They discuss real-world examples of independent and dependent relationships. In addition, they use tables, graphs, and equations to represent linear relationships. They also use ordered...
Illinois State Board of Education
Is It Linear?
Math apprentices are introduced to the components of a linear relationship. In groups, they write story problems that incorporate this relationship and relates to the real world. They give their problem to the class for them to solve.
Curated OER
Modeling Linear Relationships
Learners graph lines using the slope and y-intercept. In this algebra lesson, students create data using tables and equations. They use their data to make predictions and draw conclusion.
Curated OER
Equations from Unit Rates
Your class can become linear equations masters, as they calculate the rate of change of a function. They observe different types of coordinates as they relate to a graph, then use the Ti-navigator to move the line around and draw...


