Curated OER
Wind Effects- A Case Study
Learners explore hurricanes. In this weather data interpretation lesson, students draw conclusions about the impact of Hurricane Floyd as it related to weather conditions. Learners read and interpret a tide data table, a barometric...
Curated OER
Conditions at Sea Introductory Activity, Making Waves
Students explore waves and wind. In this physical and earth science wave instructional activity, students participate in a wave making activity with an aquarium and a hair dryer. Students complete a data chart recording wave height and...
Curated OER
Weaving Weather Maps with the World Wide Web
Learners access the Internet and use real time data from the American Meteorological Society to create a detailed weather map. They make weather predictions based on the data collected.
Center for Innovation in Engineering and Science Education, Stevens Institute of Technology
Ciese: Weather Scope: An Investigative Study of Weather and Climate
The activities in this comprehensive weather unit are designed for Grade 6 and up. Students will use real time data from around the world to conduct an investigation about weather and climate.
NOAA
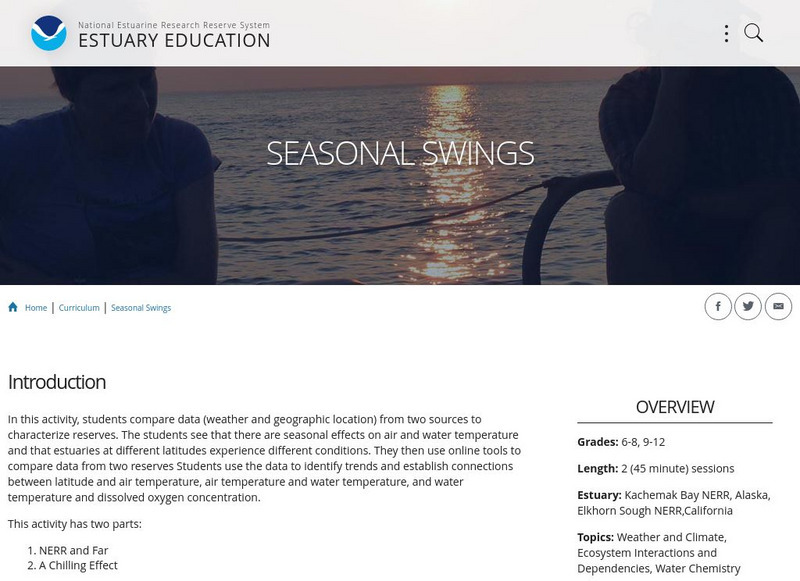
Noaa: Estuaries 101 Curriculum: Seasonal Swings
Students use an interactive map to compare environmental conditions in different estuaries around the National Estuarine Research Reserve System. A second activity allows students to use the Graphing Tool to find, select, and graph data...
Center for Innovation in Engineering and Science Education, Stevens Institute of Technology
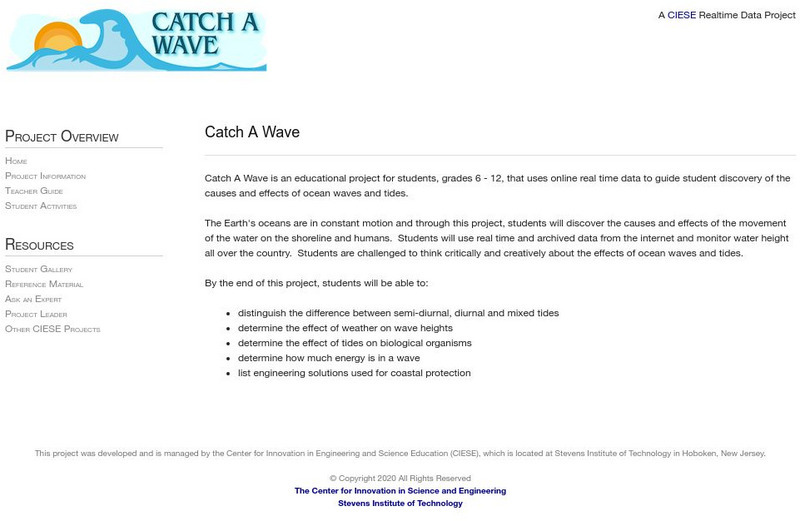
Ciese: Catch a Wave
In this project for Grades 6 to 12, students will use real data collected online to learn how waves and tides work. They will learn what causes water to move, and how waves and tides impact on humans, organisms and waterfront lands. They...
Center for Innovation in Engineering and Science Education, Stevens Institute of Technology
Ciese: Tsunami Surge
In this Science project, students use real time data on the Internet to study tsunamis and what causes them. They will look at videos of real tsunamis such as the 2004 one in Southeast Asia. They will then devise a safety plan and a...
Center for Innovation in Engineering and Science Education, Stevens Institute of Technology
Ciese Navigational Vectors
For this project, students use real time data to learn how pilots navigate when they fly. Students go through a series of lessons on vectors, weather maps and flight tracking, then take a pilot's test where they apply what they have...
Center for Innovation in Engineering and Science Education, Stevens Institute of Technology
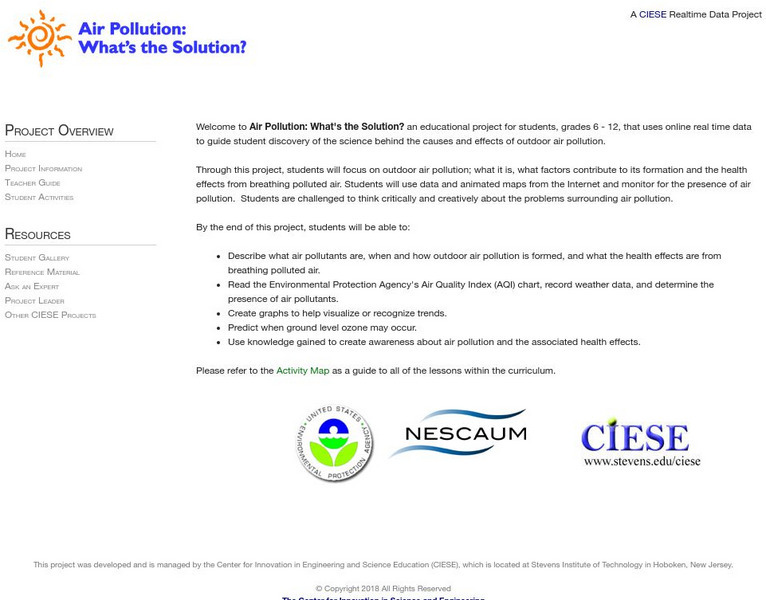
Ciese: Air Pollution: What's the Solution?
Outdoor air pollution poses a major threat to human health and threatens the ozone layer. Students will examine real time weather data in this extensive unit to learn how air quality is measured, its health impact on at-risk populations,...
Center for Innovation in Engineering and Science Education, Stevens Institute of Technology
Ciese: Stowaway Adventure Project
For this project students will learn how to track a real ship across the ocean and use real time marine data, including weather patterns, to predict when it will reach its destination. Teachers have the additional option of enrichment...
The Math League
The Math League: Ratio and Proportion
This tutorial provides definitions and examples of ratios and proportions and features comparing ratios and converting rates.
Center for Innovation in Engineering and Science Education, Stevens Institute of Technology
Ciese: Wonderful World of Weather Project
If you're studying the weather, this is an excellent project for young scholars to develop their understanding of how weather is measured. They will use real time data from their location as well as from around the world to learn about...
Incorporated Research Institutions for Seismology
Iris: Us Array Ground Motion Visualizations
The USArray Ground Motion Visualization (GMV) is a video-based IRIS DMS product that illustrates how seismic waves travel away from an earthquake location by depicting the normalized recorded wave amplitudes at each seismometer location...


