Curated OER
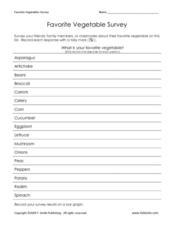
Favorite Vegetable Survey
What's your favorite? Use this chart template in your lesson on data collection and graphing. Learners record classmates' favorite vegetable in a survey, and then graph the results. A labelled graph is provided here- print both pages...
Curated OER
Cleaning an Oil Spill
Third graders use oil, feathers, eggs, rubber bands, and more to create a simulated oil spill and then clean it up. For this oil spill lesson plan, 3rd graders discuss what their cleaning process is like and how the oceans are effected...
Curated OER
Gears 1
In this gears worksheet, students put together and label gears and see how many turns it takes to go in a given directions. Students then fill in a chart with their results.
Curated OER
Sun or Shade
Students hang a thermometer in the sun and in the shade and record the results. In this sun or shade lesson plan, students hang a thermometer in sun and shade and compare the results of the temperature.
University of Illinois
University of Illinois: Data Types
The University of Illinois provides this site that is helpful because of the various kinds of data that can be collected. This lesson plan helps students differentiate between qualitative, quantitative, and many other types of data.
Mangahigh
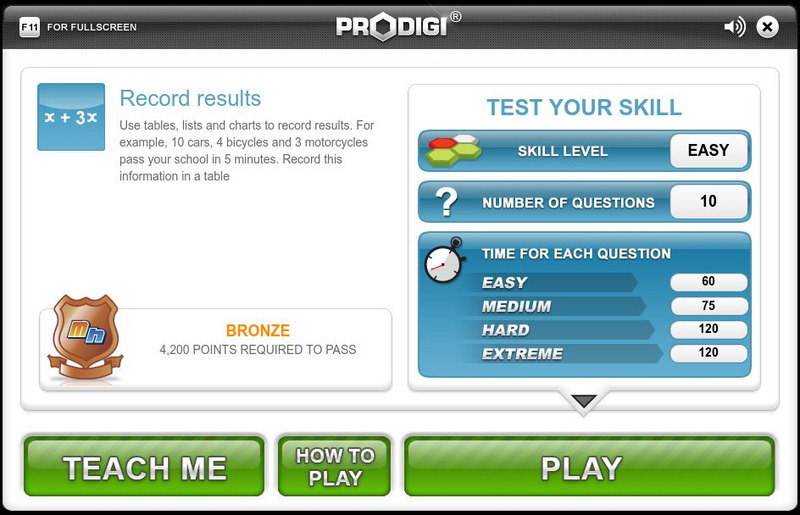
Mangahigh: Data: Record Results
Students explore the concept of recording data by working through an online tutorial and then attempting a ten question quiz that increases in difficulty as questions are answered correctly.
Science Buddies
Science Buddies: Scientific Method Data Analysis/graphs
At the end of your experiment you should review all of the data you have collected. See samples of data analysis charts and graphs. Find out what makes for a good chart or graph using the self-grading rubrics.
American Museum of Natural History
American Museum of Natural History: O Logy: Stuff to Do: Keeping a Field Journal
Learn how to record observations about the wildlife in your community by constructing a field journal.


