Curated OER
Energy Audit
Students collect data about energy usage and use mathematical calculations to analyze their data. In this energy conservation and statistics math lesson, students survey their homes to complete an energy usage worksheet. Students...
Curated OER
Student News And Weather Channel
Fabulous! Your 5th graders should love this project. As an ongoing instructional activity throughout the year students use temperature probes to record outside temperature and then document their data using spreadsheets. They use their...
Discovery Education
Fuss About Dust
Dust is everywhere around us; it's unavoidable. But what exactly is dust and are certain locations dustier than others? These are the questions students try to answer in an interesting scientific investigation. Working independently or...
Illustrative Mathematics
Favorite Ice Cream Flavor
What better way to engage children in a math lesson than by talking about ice cream? Using a pocket chart or piece of chart paper, the class works together creating a bar graph of the their favorite ice cream flavors. Learners then work...
Curated OER
Are You Full of Hot Air?
Explore the concept of measuring and recording circumference. For this physical science and measurement lesson, young learners blow up balloons, measure the circumference, and record the data on an interactive graphing website.
Curated OER
Mystery Jars
This is a twist on the old "guess how many jellybeans" game. Using estimation and math skills, learners participate in a fun "mystery jars" activity, trying to make educated guesses at how many objects are in two jars. The basic activity...
Curated OER
Ice Cream Lab
I scream, you scream, we all scream for ice cream! Even high schoolers enjoy making ice cream. This laboratory exercise has them record the temperature changes throughout the process of liquid becoming solid, graph the results, and...
Curated OER
The Life Cycle of the Mealworm
Fourth graders provide a habitat for live mealworms and observe their life cycle. In this animal life cycle and scientific inquiry lesson, 4th graders create a habitat for a live mealworm and observe and record related data as it grows....
Curated OER
Build a Catapult
Studens construct their own catapult. In this history of catapults lesson, students work in groups to make their own model of a catapult. Students use physics vocabulary terms explain how the catapult works. Students test the...
Curated OER
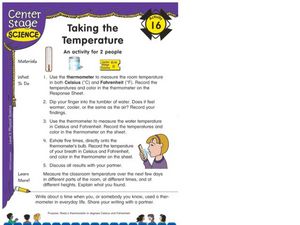
Taking the Temperature
Students read a thermometer in Celsius and Fahrenheit. In this thermometer reading lesson, students take the temperature in different situations and discuss the results with a partner.
Curated OER
Observing Properties of Matter
Third graders explore matter. In this physical science lesson plan, 3rd graders observe several items and use their five senses to describe their properties. Students record their observations and share with the class.
Curated OER
It's In The Chocolate Chips
Young scholars investigate which brand of chocolate chip cookies contains the most chocolate. They analyze and compare data using Microsoft Word and Microsoft Excel. They communicate the results with Microsoft PowerPoint.
Curated OER
Learning in Cockroaches
Students make scientific observations. In this stimulus response instructional activity, students make observations and collect data to determine if cockroaches can learn. A secondary purpose of this instructional activity is to provide...
Curated OER
Handling Data: Collecting and Recording Data
Students collect and record data. In this collecting and recording data activity, students collect data and record that data using frequency tables which include the x and y axis.
Curated OER
Lesson Plan for Science Class: Journaling
Learners complete science journals to learn about the science process using a fern as study material. In this science journal lesson, students research the resurrection fern. Learners observe the fern in dry and moist conditions and...
Curated OER
Collecting Data and Graphing
Students practice collecting and graphing data using interlocking cubes. In this graphing lesson plan, partners count cubes and graph them. They also use a meter stick to measure arm span and height then compare the results with the...
Curated OER
Cloud Key: Clouds
In this identifying clouds activity, learners cut and make a cloud wheel that they then use to help them identify the cloud formations on various days. Students create a chart to record their data.
Curated OER
Recording Data From a Survey Reteaching Worksheet
In this recording data from a surveys reteaching worksheet, 2nd graders review the use of tallies when recording data. They use the information to make a data table and a bar graph that displays the information.
Curated OER
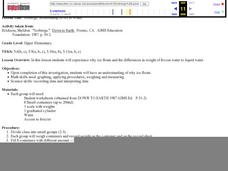
Icebergs: Relationship of Ice to Water
Students experience why ice floats and the differences in weight of frozen water to liquid water. Students explore why ice floats. They use math skills such as: graphing, applying procedures, weighing and measuring. Students also use...
Center for Innovation in Engineering and Science Education, Stevens Institute of Technology
Ciese: Collaborative Projects
Using a variety of science topics, these projects link your class with classes around the world in data collection and analysis. There are projects recommended for all grade levels. Begin dates and end dates are listed to help in...
Center for Innovation in Engineering and Science Education, Stevens Institute of Technology
Ciese Collaborative Projects: International Boiling Point Project
An Internet project designed to determine the greatest influence on the boiling point. After reading the project instructions and performing the experiment, submit your data and compare your results to other classes from around the world.
Smithsonian Institution
Smithsonian Learning Lab: Prehistoric Climate Change and Why It Matters Today
In a lesson in this issue of Smithsonian in Your Classroom, learners do the work of a team of paleontologists studying a time of rising carbon dioxide and rapid global warming during the Eocene epoch. By examining fossils of tree leaves,...
University of Illinois
University of Illinois: Data Types
The University of Illinois provides this site that is helpful because of the various kinds of data that can be collected. This lesson plan helps students differentiate between qualitative, quantitative, and many other types of data.
Other
Global Grocery List Project: Homepage
At this site from the Global Grocery List Project, students collect data on the prices of common grocery items and submit their findings. They can then compare the data they collected to data from students around the world. There are...


