Curated OER
Curve Fitting
Pupils investigate linear, quadratic, and exponential regressions. They plot sets of data points, determine the regression equation that best fits the data and lastly investigate the coefficient of determination.
Curated OER
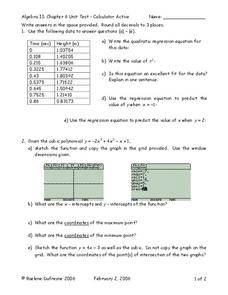
Polynomial Functions
In this Algebra II worksheet, 11th graders use a graphing calculator to determine the regression equation of the given data, graph polynomial functions, factor polynomials, and determine the quotient and remainder in polynomial division....
Texas Instruments
Texas Instruments: Glencoe Algebra 1: Graphing Calculator Investigation Curve
Students will make scatter plots and find the appropriate regression equations that best fit the data.
Texas Instruments
Texas Instruments: Exploring Circles
Explore the relationship between the center and radius of a circle and the equation of the circle. Collect data and determine regression equations related to various combinations of data, and use the regression equations to make...
Stefan Warner and Steven R. Costenoble
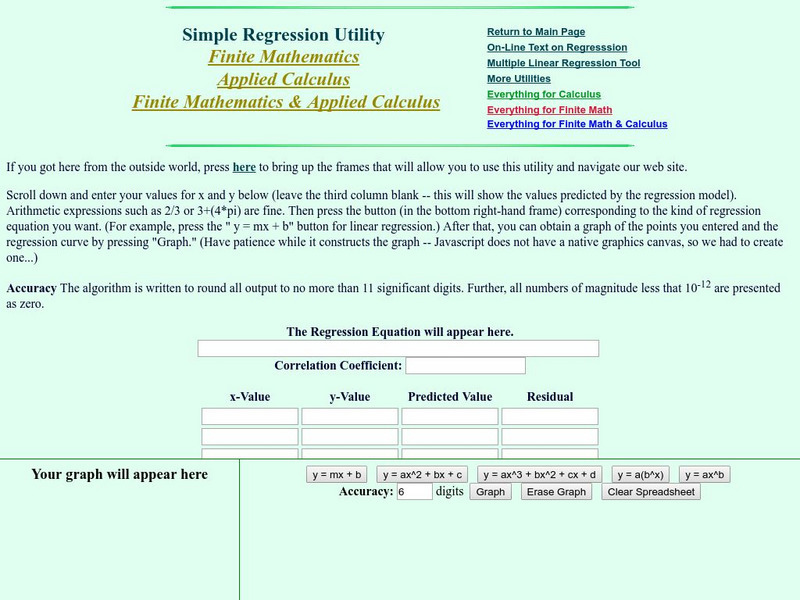
Finite Mathematics & Applied Calculus: Simple Regression Utility
Students explore regression equations using the graphing utility. Multiple kinds of regressions can be created using the learning tool.


