Curated OER
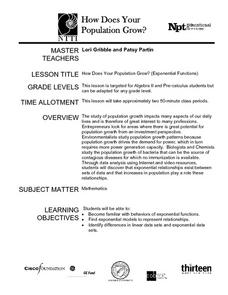
How Does Your Population Grown?
Do you know how the population has grown of your community? Can you predict the population over the next half century? Can we find an algebraic model that matches our data? These along with many more questions can be researched by...
Curated OER
Comparison of Two Different Gender Sports Teams - Part 3 of 3 Scatter Plots and Lines of Best Fit
Students create a scatter plot for bivariate data and find the trend line to describe the correlation for the sports teams. In this scatter plot lesson, students analyze data, make predictions,and use observations about sports data...
Missouri State University
Missouri State University: Introductory Statistics: Linear Regression Models
Four examples which use the linear regression model in real-world applications. The site continues with discussion on how to correctly construct the regression model, how its results can be analyzed, and what can come from it.
Texas Instruments
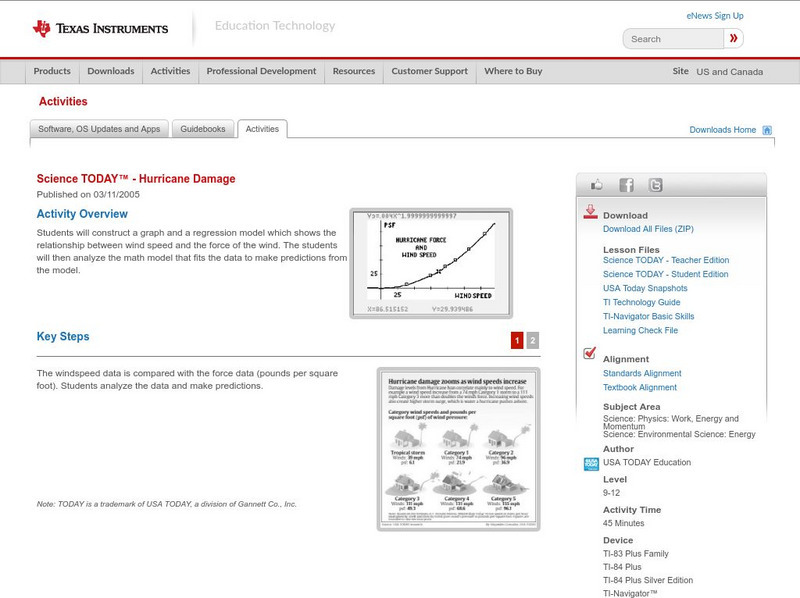
Texas Instruments: Science Today Hurricane Damage
Students will construct a graph and a regression model which shows the relationship between wind speed and the force of the wind. The students will analyze the math model that fits the data to make predictions from the model.
Texas Instruments
Texas Instruments: Growing Babies
In this activity, students observe and graph data about human fetal growth rates. Students build a regression model based on the data and compare values with those of other mammals. They also compare the data to non-mammal species.
Texas Instruments
Texas Instruments: The River of Life
In this activity, students compare human body mass with blood volume. They graph the data and build a regression model. They estimate their own blood volume and also predict volumes of blood for other animals.


