Scholastic
Study Jams! Identify Outcomes and Make Predictions
Boy, girl, girl, boy? Make a prediction on what kind of puppies you are going to get during this video that introduces outcomes. Knowing how to make an educated prediction is even more important, and this lesson focuses on what to look...
Curated OER
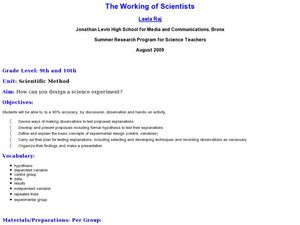
The Working of Scientists
Students define and explain the basic concepts of experimental design. In this scientific method lesson students complete a hands on activity, develop and present proposals to test their explanations.
Curated OER
Survey Project
Eighth graders create a website using FrontPage. They use inserted forms to collect survey information and use Microsoft Excel and MS Word to create a presentation of the survey and the results.
Curated OER
Erosion: On the Move...Defending the Coast Against Wave Attack
Students study how people have tried to save beaches from wave erosion. They examine what has occurred to Cape Hatteras as a result of beach erosion and the efforts to reduce the erosion.
Curated OER
Investigations
In this investigations worksheet, students describe the investigative steps: recall, explain, results, and uncertainties. This worksheet has 5 short answer questions.
Curated OER
Picture Graphs
In this mathematics worksheet, students look at pictures and identify how many of each object is illustrated. Then they graph their results on the graph given. Students also draw tally marks to count how many faces are in the pictures.
Curated OER
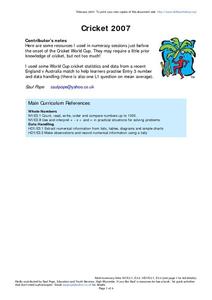
Cricket 2007
In this math and sports instructional activity, students read and review the statistics from the performance of teams in the Cricket World Cup. They identify which team played the most matches and who won the most. Students also compare...
Curated OER
Research Project
Students identify the components of the Results section of the project and technical paper.They also identify appropriate ways of presenting data and write the Results section of the technical paper.
University of Illinois
University of Illinois: Data Types
The University of Illinois provides this site that is helpful because of the various kinds of data that can be collected. This lesson plan helps students differentiate between qualitative, quantitative, and many other types of data.
Science Buddies
Science Buddies: Scientific Method Conclusion
The conclusion of a science experiment summarizes how your results supported or contradicted your hypothesis. See a sample of a conclusion and find out what makes a good conclusion.
University of California
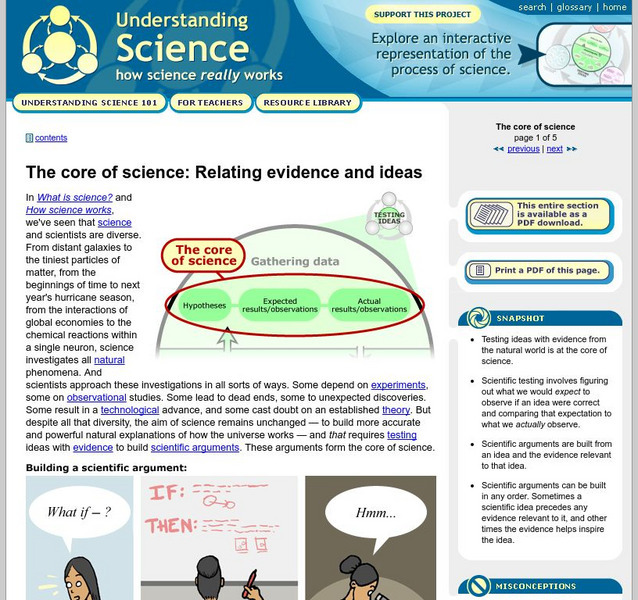
Understanding Science: The Core of Science: Relating Evidence and Ideas
Learn that the real process of science proceeds at multiple levels and sorts through many ideas, retaining and building upon those that work, and relating the evidence discovered with scientific ideas.
Read Works
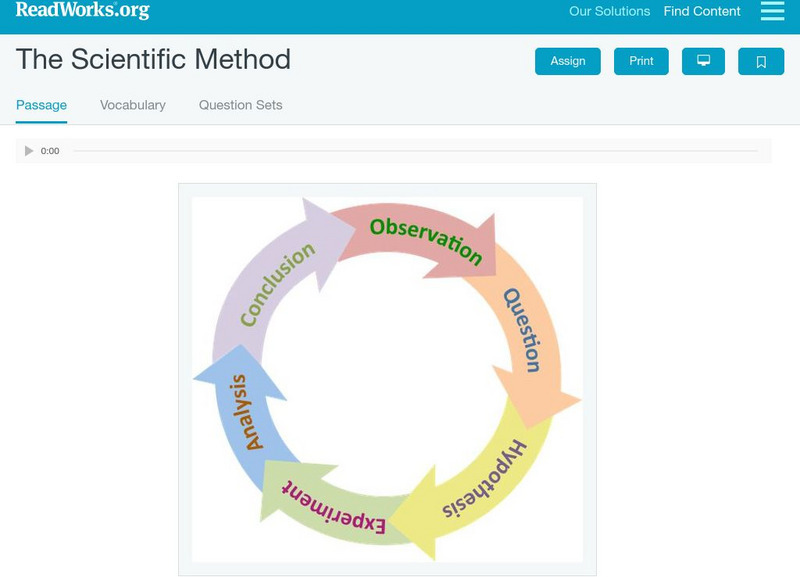
Read Works: The Scientific Method
[Free Registration/Login Required] An informational text explaining the five steps of the scientific method. A question sheet is available to help students build skills in reading comprehension.
Science Buddies
Science Buddies: Scientific Method Data Analysis/graphs
At the end of your experiment you should review all of the data you have collected. See samples of data analysis charts and graphs. Find out what makes for a good chart or graph using the self-grading rubrics.
Other
Gphsf: Basic Project Timeline
This resource is a short piece, part of a larger page, on conducting your experiment. It contains a lot of good advice.
Sophia Learning
Sophia: Steps of the Scientific Method: Lesson 4
This lesson will explain the steps involved in the Scientific Method. It is 4 of 4 in the series titled "Steps of the Scientific Method."
Sophia Learning
Sophia: Steps of the Scientific Method: Lesson 1
This lesson will explain the steps involved in the Scientific Method. It is 1 of 4 in the series titled "Steps of the Scientific Method."


