Centre for Innovation in Mathematics Teaching
Ten Data Analysis Activities
This thirteen page data analysis worksheet contains a number of interesting problems regarding statistics. The activities cover the concepts of average measurements, standard deviation, box and whisker plots, quartiles, frequency...
Curated OER
Data Analysis
Young statisticians use and interpret measures of center and spread such as mean, median, and mode as well as range. They use box plots to represent their data and answer questions regarding the correspondence between data sets and the...
Curated OER
What is the Average Height of Your Class?
In this statistics lesson, learners use an on-line form generator create a class-specific form, then complete the form, view a graph and data analysis, and draw conclusions.
Google
Google for Education: Application and Modeling of Standard Deviation
Students examine graphs of data using each of the measures of central tendency to determine when to use each in order to get a true overview of the data.
Texas Education Agency
Texas Gateway: Descriptive Statistics: Bringing It Together: Homework
In this set of homework exercises, students apply what they have learned about descriptive statistics.
Missouri State University
Missouri State University: Introductory Statistics: The Normal Curve
Provides lengthy explanations of the measures of central tendencies - mean, mode, and median - and the measures of variability - range, variance, standard deviation - are given here. Graphs of interesting "side items" are presented as...
Alabama Learning Exchange
Alex: My Peanut Butter Is Better Than Yours!
This lesson plan provides a real-world example of using a scatter plot to compare data. It gives an assessment and ideas for remediation, extension as well as ways to manage behavior problems and reluctant learners.
University of Regina (Canada)
University of Regina: Math Central: Central Tendency Activity
An Internet activity that creates data to be evaluated using statistics skills such as central tendency, data analysis, and graphing. The topic of the exercise is the average height of a student's class.
University of Georgia
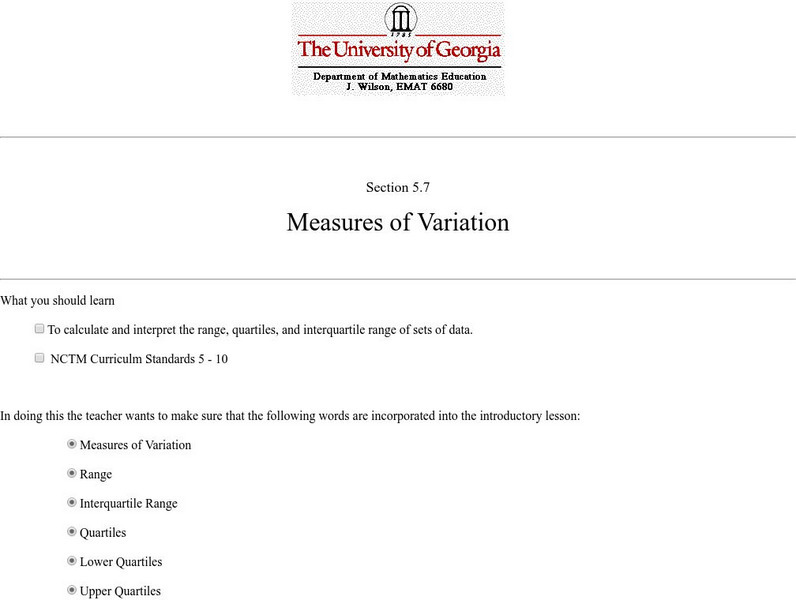
University of Georgia: Measures of Variation
Lesson plan introduces and explains how to calculate measures of variation concepts such as range and quartile.
Beacon Learning Center
Beacon Learning Center: All That Data 2
Students describe graphs and explore range, measures of central tendency, and distribution in this interactive web lesson.
Beacon Learning Center
Beacon Learning Center: All That Data
Students analyze data by finding the mean, median, mode, and range of a set of numbers. Line plots, bar graphs, and circle graphs are also included in this lesson.
Other
Csulb: Stem: How Much Water Fits on a Penny? [Pdf]
Students explore mean, median, mode, and range with this hands on activity.
McGraw Hill
Mc Graw Hill Education: Glencoe: Measures of Variation
Lesson examples that review how to calculate measures of variation such as range and outliers.
Other
Raymond Geddes and Company, Inc.: Analyzing Product Price and Sales Data
Lesson plan provides a real-world application of mean, median, mode, and range.
Beacon Learning Center
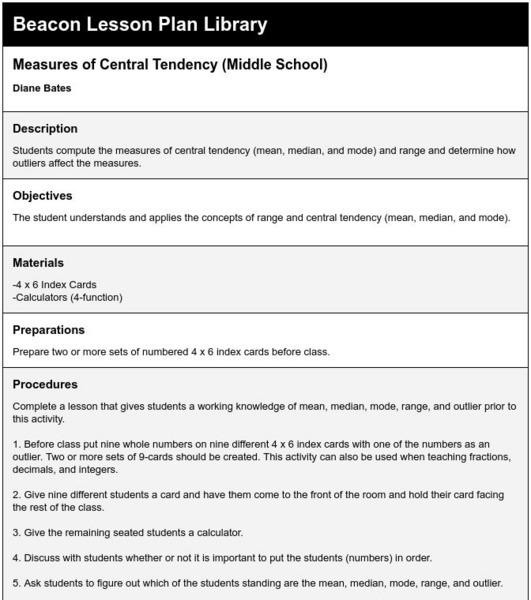
Beacon Learning Center: Measures of Central Tendency (Middle School)
Lesson plan provides practice for calculating measures of center.
Illustrative Mathematics
Illustrative Mathematics: 7.sp.3,4 College Athletes
Below are the heights of the players on the University of Maryland women's basketball team for the 2012-2013 season and the heights of the players on the women's field hockey team for the 2012 season. (Accessed at...
Palomar Community College District
Palomar College: Mode, Median, Mean Examples
A series of step-by-step worked problems demonstrating how to take a set of data and produce the measures of central tendency. Hints are provided along the way and the final measures are shown for the user to check.
CK-12 Foundation
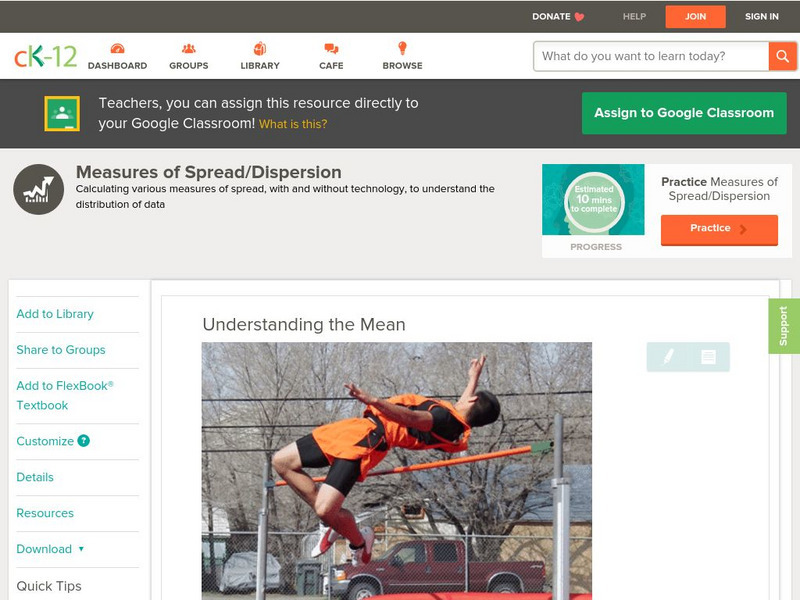
Ck 12: Statistics: Measures of Spread/dispersion Grade 8
[Free Registration/Login may be required to access all resource tools.] Understanding the mean and statistical deviations.
CK-12 Foundation
Ck 12: Summary Statistics: Summarizing Univariate Distributions
[Free Registration/Login may be required to access all resource tools.] This concept teaches students about other measures of center such as the mid-range, trimmed means and weighted mean. It also introduces the concept of percentiles,...
Alabama Learning Exchange
Alex: The Mean, Median, and Mode Chain Gang
Cooperative learning groups and chain links are used to find the mean, median, and mode. A Science NetLinks lesson plan is linked for further real-life application in the world of baseball (optional). This lesson plan was created as a...
Quia
Ixl Learning: Mean, Median, Mode, and Range
Brush up on your math skills relating to mean, median, mode, and range then try some practice problems to test your understanding.
University of Glasgow
Steps Statistics Glossary: Expected Value
Site defines statistical expected value as the population mean and discusses it's usefulness as a summary value of a variable's distribution. The formula for calculating expected value is provided, as is an example.
Rice University
Hyper Stat Online Statistics Textbook: Summary of Measures of Central Tendency
Site discusses which method of central tendency is most appropriate for different purposes.
Other
James Wright: Measures of Central Tendency
This site looks at measures of central tendency and dispersion. Discussed are topics such as standard deviation, mean, median, and mode.


![Csulb: Stem: How Much Water Fits on a Penny? [Pdf] Lesson Plan Csulb: Stem: How Much Water Fits on a Penny? [Pdf] Lesson Plan](https://d15y2dacu3jp90.cloudfront.net/images/attachment_defaults/resource/large/FPO-knovation.png)


