Curated OER
Bar Graphs and Histograms
In this bar graphs and histograms worksheet, students create bar graphs and histograms from given information. They interpret graphs. This one-page worksheet contains 6 multi-step problems.
Curated OER
Range and Mode Practice 4.5
In this range and mode worksheet, students study a data table that shows the ages of children in a school play. Students solve 5 problems pertaining to the range and mode of the information.
Curated OER
Statistics
In this statistics worksheet, 9th graders solve and complete 8 different problems that include various measures of central tendency. First, they find the mean, median, and mode for each set of data. Then, students find the median and...
Curated OER
Fruit Loops/Cheerios Activity: Measures of Central Tendency
In this measures of central tendency activity, students use Fruit Loops and Cheerios to gather statistical data. They find the mean, mode and median of the data. Students construct a box-and-whisker plot of the class data. This...
Curated OER
Measures of Central Tendency: Range
In this measures of central tendency worksheet, students complete 40 problems in which a set of data is analyzed and the range is calculated. This page is intended as an online activity, but may be completed on paper.
Curated OER
Mean, Median, and Mode 1
In this mean, median and mode worksheet, students use the measures of central tendency to describe given statistical data. Students identify the range of data, and match data to its representative bar graph. Two multi-step problems are...
Curated OER
Mean, Median, Mode and Range Sheets
In this math worksheet, students use the graphic organizer to display their answers when learning about measures of central tendency. There are 4 boxes: mean, median, mode and range.
Curated OER
High School Mathematics Problems from Alaska: Fire Fighting Crew
High schoolers apply mean, median and mode calculations of firefighter test scores to decide on hiring.
Shodor Education Foundation
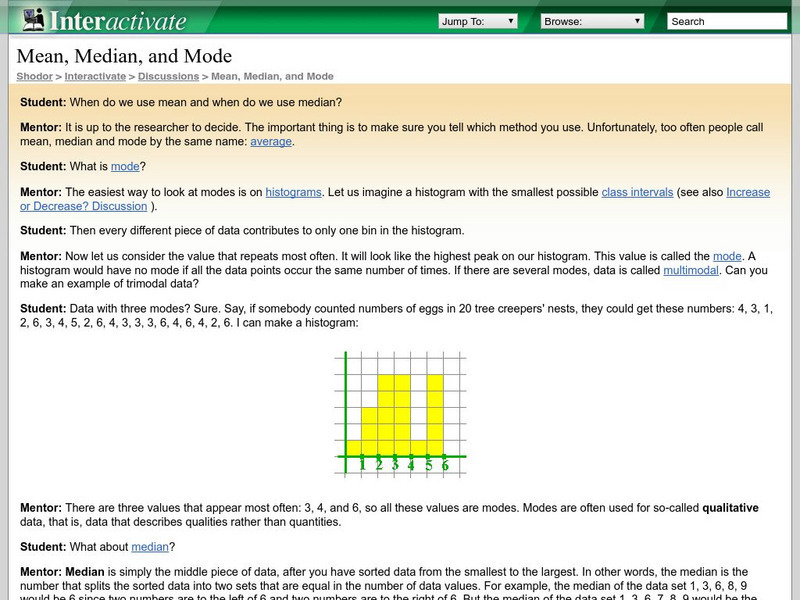
Shodor Interactivate: Mean, Median, and Mode Discussion
This is a virtual discussion between a mentor and student involving mean, median, and mode. Discusses when each is used and how they are found.
Oswego City School District
Regents Exam Prep Center: Displaying Data
Use this lesson, practice exercise, and teacher resource in planning instruction on displaying data. In the lessons, you'll find definitions and examples of ways to collect and organize data, quartiles, and box-and-whisker plots, as well...
Missouri State University
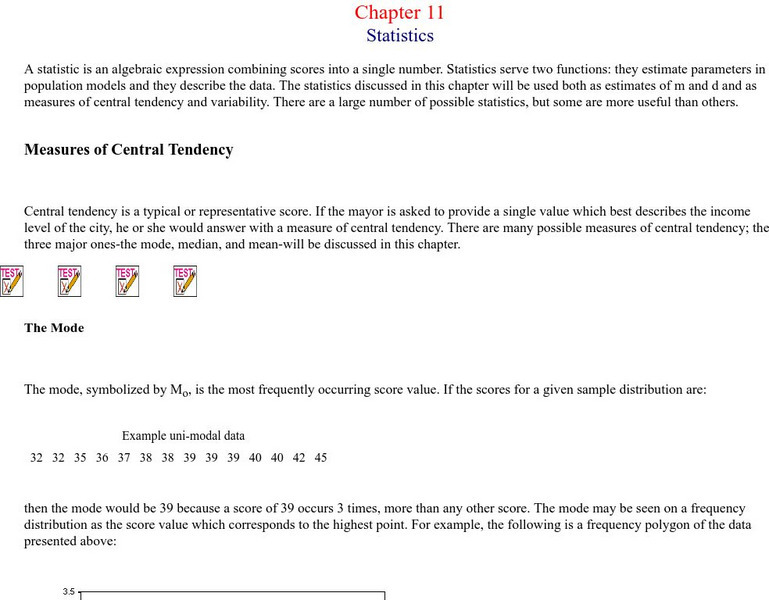
Missouri State U.: Statistics: Measures of Central Tendency and Variability
Provides lengthy explanations of the measures of central tendency - mean, mode, and median - and the measures of variability - range, variance, standard deviation. Graphs of interesting examples are presented as well, skewed...
Cuemath
Cuemath: Measures of Central Tendency
A comprehensive guide for learning all about measures of central tendency with definitions of mean, median, and mode, solved examples, and practice questions.
Houghton Mifflin Harcourt
Holt, Rinehart and Winston: Homework Help Independent Practice: Measures of Central Tendency
Get independent practice working with the mean, median and mode. Each incorrect response gets a text box explanation and another try. Correct responses are confirmed.
Texas Instruments
Texas Instruments: Measures of Central Tendency
Mean, median, and mode are measures of central tendency in data analysis. Each can be used to identify central tendency. Box-and-whiskers plots are a visual representation of collected data involving medians.
Science Education Resource Center at Carleton College
Serc: Nitrate Levels in the Rock Creek Park Watershed: Meas of Central Tendency
Activity uses water-quality data from Rock Creek Park to illustrate elementary statistical measures of exploratory data analysis. The focus of the lesson is the nutrient limitation in a stream and the three measures of central tendency.
Stefan Warner and Steven R. Costenoble
Finite Mathematics & Applied Calculus: Measures of Central Tendency
Students learn about measures of central tendency. Topics explored are mean, median, mode, and expected value. The tutorial investigates the statistics concepts through class notes and examples. Review exercises and a chapter quiz are...
Rice University
Hyper Stat Online Statistics Textbook: Central Tendency
Click on mean, median, mode, trimean, or trimmed mean to review central tendency.
Beacon Learning Center
Beacon Learning Center: All That Data 2
Students describe graphs and explore range, measures of central tendency, and distribution in this interactive web lesson.
Other
High School Operations Research: Torn Shirts Inc.: Telephone Orders
A group of high school students need help determining how they will make the most profit selling T-shirts. They use data to analyze a business problem and apply probability concepts.
McGraw Hill
Glencoe Mathematics: Online Study Tools: Measures of Central Tendency
This site gives a short interactive quiz which allows students to self-assess their understanding of the concept of measuring central tendency.
McGraw Hill
Glencoe Mathematics: Quiz on Measures of Central Tendency
Students examine advanced mathematics concepts with this online quiz. The assessment shows comprehension of measures of central tendency. Topics include mean, mode, and median.
Sophia Learning
Sophia: Finding Mean, Median, and Mode: Lesson 1
This lesson will demonstrate how to find the mean, median, and mode for a set of data. It is 1 of 5 in the series titled "Finding Mean, Median, and Mode."
TeachEngineering
Teach Engineering: Bubbling Plants
Students learn a simple technique for quantifying the amount of photosynthesis that occurs in a given period of time, using a common water plant (Elodea). They can use this technique to compare the amounts of photosynthesis that occur...
CK-12 Foundation
Ck 12: Statistics: Mean Grades 9 10
[Free Registration/Login may be required to access all resource tools.] Find the mean of a set of data.


