Houghton Mifflin Harcourt
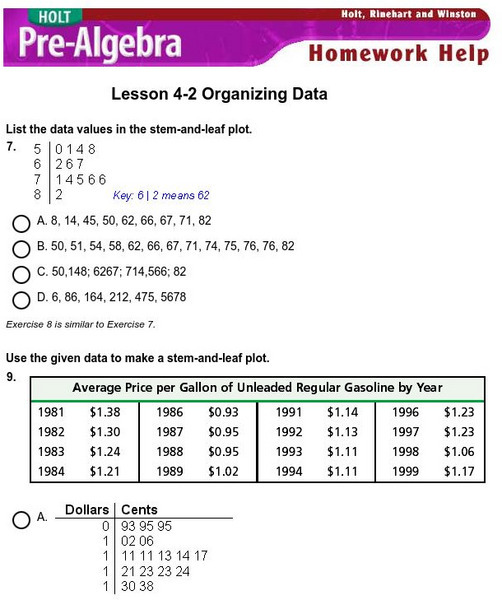
Holt, Rinehart and Winston: Homework Help Independent Practice: Stem and Leaf Plot
Get independent practice organizing data and using stem-and-leaf plots. Each incorrect response gets a text box explanation and another try. Correct responses are confirmed.
Shodor Education Foundation
Shodor Interactivate: Stem and Leaf Plot
Shodor offers this interactive Stem and Leaf Plotter. The mean, median, and mode may be calculated or checked for accurracy with your given data. Be sure to check the "What?" link to find exercises and a lesson plan.
Texas Instruments
Texas Instruments: How Far to Your Birthplace
Examine one-variable data analysis through the creation and exploration of a birth place data set. Graphing calculators are used to analyze the data through mean, median, mode, maximum, minimum, stem-and-leaf plots and box-and-whisker...
Rice University
Hyper Stat Online Statistics Textbook: Stem and Leaf Plots Defined
A nice site for a defintion and example of finding a stem and leaf plot in statistics.
Math Is Fun
Math Is Fun: Stem and Leaf Plots
Explains, with examples, what stem and leaf plots are. Includes a set of practice questions.
Annenberg Foundation
Annenberg Learner: Organizing Data in a Stem and Leaf Plot
A stem and leaf plot is a graphical representation for investigating variation. You will convert an ordered stem and leaf display grouped by tens into an ordered display grouped by fives.
National Council of Teachers of Mathematics
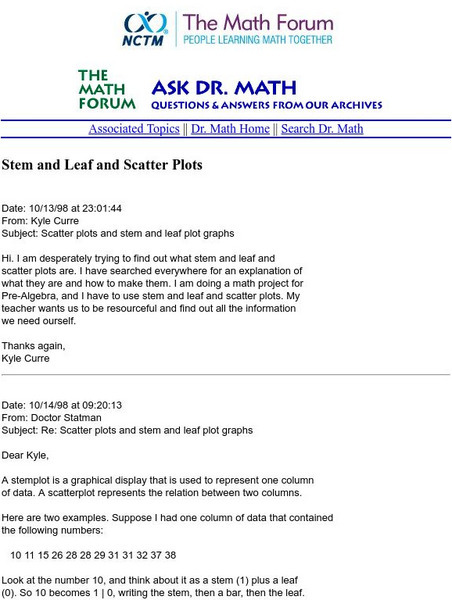
The Math Forum: Nctm: Ask Dr. Math: Stem and Leaf and Scatter Plots
This site is a question/response page which focuses on stem-and-leaf representation and how to construct scatter plots. Dr. Math works through an example and gives commentary notes. Site also contains links for more help.
National Council of Teachers of Mathematics
Nctm: Illuminations: State Names
Students use multiple representations to display how many times the letters of the alphabet is used in a state name. Concepts explored: stem and leaf, box and whisker plots, histograms.
Other
Stem and Leaf Plotting
A nice explanation of a stem and leaf plot, accompanied by many helpful examples.
Sophia Learning
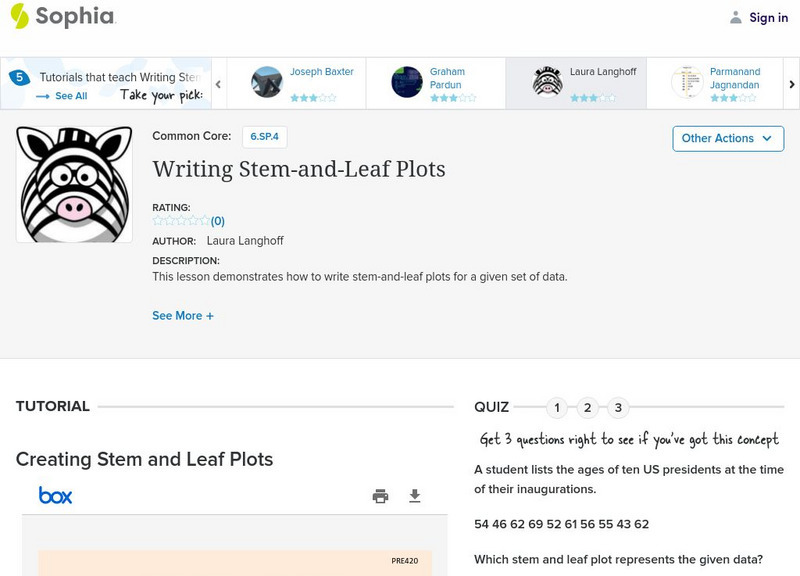
Sophia: Writing Stem and Leaf Plots: Lesson 3
This lesson demonstrates how to write stem-and-leaf plots for a given set of data. It is 3 of 5 in the series titled "Writing Stem-and-Leaf Plots."
Sophia Learning
Sophia: Writing Stem and Leaf Plots #3
This lesson demonstrates how to write stem-and-leaf plots for a given set of data.
Sophia Learning
Sophia: Writing Stem and Leaf Plots: Lesson 4
This lesson demonstrates how to write stem-and-leaf plots for a given set of data. It is 4 of 5 in the series titled "Writing Stem-and-Leaf Plots."
Sophia Learning
Sophia: Writing Stem and Leaf Plots #4
This lesson demonstrates how to write stem-and-leaf plots for a given set of data.
University of Illinois
University of Illinois: Statistics a La Mode
Site from the University of Illinois gives examples using stem and leaf plots to find the mode. It also provides practice examples for students to try. It gives the correct answers and provides a definition of the word mode and where it...
McGraw Hill
Glencoe: Interpreting Data Quiz
This is a quiz with five quick questions to check your understanding of how to interpret data. It is self checking.


