Curated OER
What Did It Cost 100 Years Ago?
Students compare prices of good across the century in order to introduce the topic of inflation. They undertand the concepts of inflation and Consumer Price Index (CPI), use online calculators to figure the approximate cost of goods...
Curated OER
Graphing With Candy
Students gather information and interpret the results using a tally chart, a table, and a bar graph.
Curated OER
Exploring F function Graphs
Using three set of data that relate temperature to another variable, 10th graders will use graphs, tables, or equations to make predictions about data. Students will identify the relations as linear or non-linear. Students will define...
Curated OER
Measurement: Stream Flow & Stadium Capacity
Eighth graders study the scientific fields and how information can be monitored and recorded. For this scientific inquiry lesson students view a PowerPoint presentation and complete a hands on activity.
Curated OER
Cool Tools to Solve Challenging Word Problems
Young scholars solve math word problems. In this cool tools lesson, students are introduced to the K-N-W-S method. Young scholars work in groups and complete a worksheet using this method of learning.
Curated OER
Variation
In this variation worksheet, students interpret and organize data. They find the distance between points. Students use ratios to determine volume This six-page worksheet contains approximately 20 problems. Answers are provided on the...
Curated OER
Frequency Histograms, Bar Graphs and Tables #3
In this frequency histograms worksheet, students examine bar graphs, histograms and tables. They identify the model of information that best matches the statistics. This three-page worksheet cotnains two multiple-choice problems. ...
Curated OER
The Number Table Problem
In this number table problem, students explore tables and determine the number pattern. This one-page worksheet contains 1 problem. Answers are provided at the bottom of the page.
Curated OER
Tables and Linear Graphs
In this tables and linear graphs worksheet, students examine linear functions. They solve equations and graph them on a coordinate plane. This four-page worksheet contains 8 multi-step problems. Answers are provided on the last page.
Curated OER
Table Readings
In this table worksheet, students read questions and interpret tables. Questions include information concerning unemployment, oil imports, and foreign students. This multiple-choice worksheet contains 10 problems. Answers are provided.
Curated OER
Use or Make a Table
In this make a table worksheet, students read real world questions and write an equation to match the equation. Next, they solve the equation. This one-page worksheet contains two problems.
Curated OER
Using a Chart to Track Book Sales
On this using a chart to track book sales worksheet, students use the chart for 6 types of books sold over a 6 day period to answer 8 fill in questions about interpreting the chart.
Curated OER
Sampling
In this sampling worksheet, students collect samples concerning the heights of classmates. They determine the mean height for the population. This two-page worksheet contains 4 problems.
Curated OER
Table of Measures and Area
In this measurement and area worksheet, students complete a table by carefully estimating and then measuring the listed objects. They find 3 objects to measure, use the proper measuring tool, and complete table. They can complete a...
Curated OER
Place Value Through Hundred Thousands
In this place value worksheet, students study and examine the data in a table about 5 popular female names. Students solve 4 word problems utilizing the data from the table.
Curated OER
Dance Decisions
In this making decisions learning exercise, 5th graders look over two charts/tables involving dance decisions and answer six mathematical questions relating to the charts/tables.
Curated OER
Relations
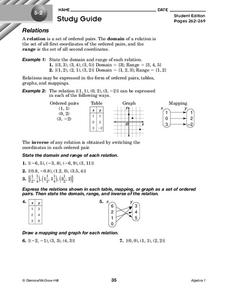
In this relations instructional activity, 10th graders solve and complete 7 different problems that include defining various relations of number sets. First, they state the domain and range of each relation. Then, students express the...
Curated OER
Skating Data
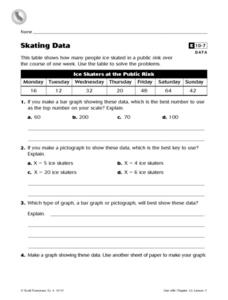
In this collecting data worksheet, 4th graders view a table on ice skaters at a public rink in order to answer 2 multiple choice questions, 1 short answer question and make a graph showing one piece of the data.
Curated OER
Word Problem Solving Strategies
In this word problem solving strategies worksheet, 6th graders solve and complete 11 different problems and questions related to identifying word problems. First, they explain what the problem is telling them to do and what is important....
Curated OER
Using A Table
In this table activity, learners observe information in a table, and then answer ten questions pertaining to the information. They must correctly read a table in order to arrive at the correct answer. Questions pertain to features of a...
Curated OER
Graphing
Young scholars gather statistical information on a chosen topic and place it into a spreadsheet. Using th Excel chart wizard, students create tables, graphs and charts of their information. They interpret the data and share it with the...
Curated OER
Create a Table
Students set up a simple table in Microsoft Word. They assess the terms columns and rows and compare the bingo card to a table, that will be created in Microsoft Word. They insert text files, graphics, or other objects into an existing...
Curated OER
Compare and Contrast Culture
Fifth graders compare and contrast the cultures of American culture with that of the other cultures of North America. Using traditional and Internet research, 5th graders gather data on one element of culture for comparison. Data...
Curated OER
Data From Interviews
Students create and conduct a survey about favorite foods, gather and represent the data, interpret data and make predictions to present to the class. They create and use interview questions to gather data. Pupils are explained that...


