Curated OER
An Immigration Graph
Students practice reading and understanding information in a table and converting the information to graph form. They create a graph showing the number of immigrants per country of origin between 1899 and 1924.
Curated OER
How to Buy a Computer
Students investigate the purchase of a specific computer hardware with specific components without going over a budget. The use of computer catalogues, tables, and spreadsheets support the search.
Curated OER
Technical Literacy
Students explore the components of the transference of technological information through this ten instructional activity unit. The applications to specific careers, the determination of responsible use of technology, and the affects of...
Curated OER
The Largest Volcano on Earth
Students create time-lines of tow major eruptions and use this information to determine what happens during an eruption. In this volcano lesson students read information about previous eruptions and create a time line.
Curated OER
Potential Energy
Students examine the concept of potential energy and see that it is the ability to do work. In this energy lesson students complete several activities on potential energy.
Curated OER
Speaking and Listening
In this basic mathematics worksheet, students follow instructions as given to play a math game. They listen for detail in explanations and narratives in various contexts. Students also provide feedback and confirmation of what they...
Curated OER
Thinking Systematically
Sixth graders solve real life mathematics problems. After reading a given problem, 6th graders gather and organize data into a table. They explore a pattern, and from this, derive a formula. Students solve the problems multiple ways...
Curated OER
Making A Table
Sixth graders explore creating tables as a way to organize data. Students read story problems and discuss methods and strategies to solve them. They practice drawing tables, spotting patterns, and identifying missing information.
Curated OER
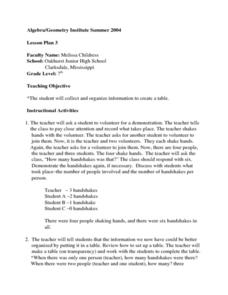
Creating a Data Table
Seventh graders explore organizing data into a table. The teacher leads a handshaking activity among the class. They collect the information concerning the number of handshakes each person received. Students discover a pattern. They...
Curated OER
Finding Rates
Fifth graders explore the concept of rates and how to solve them in problems. They solve the problems using multiplication. The majority of the lesson is direct instruction with the students being included in the process.
Curated OER
Using an Amortization Table
Students search the Internet to find a site that contains an amortization table and make a hypothesis about the results of changing time and rate. They examine the affects of time and rate on a mortgage and discuss the difference in the...
Curated OER
Charting Weight
Sixth graders record the weight of themselves and 3 family over a week, and then use that data to compile 2 bar graphs and 4 line graphs and answer a series of questions.
University of Kentucky
University of Kentucky: Chemcomics: Bismuth
Five comic strips from the 60's involving bismuth. There are not vast amounts of information, but they could be great graphics for a report or presentation.
PBS
Pbs Learning Media: Using Data Clusters to Find Hacker
The CyberSquad searches for Hacker's castle based on a survey of where town residents have last seen him in this video from Cyberchase.
Language Guide
Language Guide: El Comedor
Learn a relatively complete list of vocabulary surrounding the dining room. Interactive audio and visual vocabulary appear as the mouse moves over illustrations.
US Geological Survey
Bismuth
A listing of all sorts of available reports on bismuth. Great resources for students at many levels.
Amethyst Galleries
Amythest Galleries: Bismuth
This resource provides information about bismuth, bismuth ores and their crystals.
Texas Education Agency
Texas Gateway: Scientific Investigation and Reasoning Data Organization
Using interactive exercises, students will review how to construct tables and graphs in order to organize data.
Yale University
Solving Problems by the Hundreds
This site contains a study of percentage and its applications in the study of consumer related problems. Problems involving sales tax are included. Examples, explanation, solutions and a bibliography are also included in the site.
Savvas Learning
Chemistry, the Central Science: Enthalpies of Formation
A section from a textbook about enthalpies of formation. Includes practice exercises, a table of enthalpy values, and examples.
Texas Education Agency
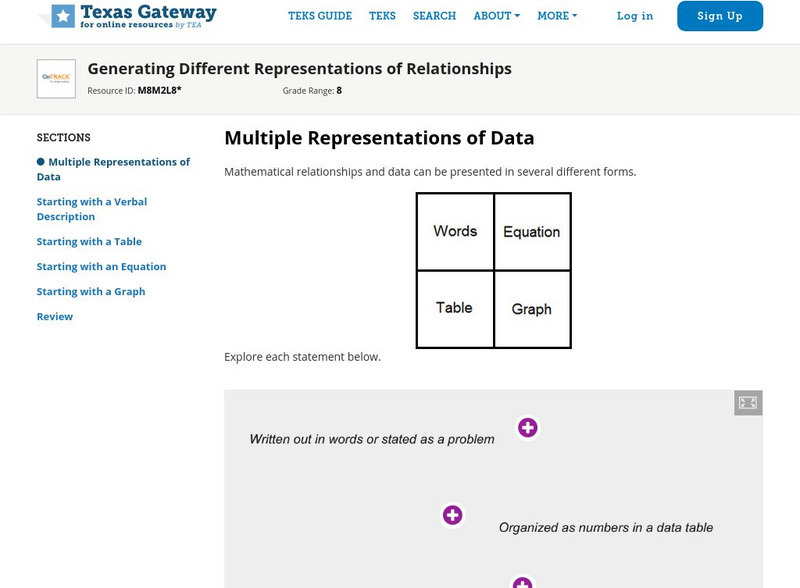
Texas Gateway: Generating Different Representations of Relationships
Given problems that include data, the student will generate different representations, such as a table, graph, equation, or verbal description.
National Center for Ecological Analysis and Synthesis, University of California Santa Barbara
Kids Do Ecology: Data and Science
Learn about conducting your own investigation with these tips on following the scientific method. Find out how to state hypothesis, make observations, collect and analyze data, and display data to share results and conclusions of your...
University of Waterloo (Canada)
Wired Math: Organizing Data Grade 7 [Pdf]
A collection of worksheets that focus on data analysis and organizing data. Includes detailed examples, colorful visuals, and a link to a related game. Acrobat Reader required.
Discovery Education
Discovery Education: Science Fair Central: Investigation Set Up and Collect Data
A brief overview of how to gather both quantitative and qualitative data, complete with a sample data table.


