Curated OER
Data Collection and Presentation
Middle and high schoolers collect and analyze data from four different activities. The activities include information about classmates, tallying colors of cars in a parking lot, stem and leaf plots, and making a histogram from winning...
Curated OER
Pet Tally
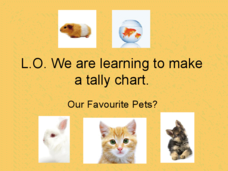
Give the class an opportunity to practice using tally marks as a way to collect data. As you progress through the slide show, learners tally up the number and types of pets they see, they then use their data to create a tally chart....
Curated OER
Reading Bar Charts
Help kids understand how to collect data through surveys, organize data in a bar chart, then analyze their findings. There are three different surveys for learners to conduct, a full description of all the parts of a bar chart, and three...
Curated OER
Make a Table
First and second graders participate in an experiment then create a table of tally marks to identify the totals. They problem solve, tally twenty experiences, and generate an answer to one question.
Curated OER
Data Analysis: For Little Learners
Using pictographs, tally charts, and surveys, kids learn all about data analysis and collection. They make surveys, collect data, then construct pictographs and tally charts to organize their information.
Curated OER
Choose a Graph to Display Data
In this math graphs worksheet, students write line plot, tally chart, pictograph, or bar graph to tell the best kind of graph to use to answer the six questions.
Curated OER
Collect and Organize Data - Practice 14.1
In this data collection worksheet, students read the word problem and study the tally chart about favorite sports. Students then use the information in the chart to answer the questions. Students then use the list about students'...
Curated OER
Holiday Tally
For this tally chart worksheet, students ask ten friends which of 3 holidays they like best. Students create a tally chart with their results and answer 6 questions.
Curated OER
Classy Fractions
In this fractions worksheet, students find the total numbers of students in their class and ask each student 7 questions provided. Students make a tally chart to record the responses and calculate the fraction of the class that answered...
Curated OER
Tally Chart/Pictograph
In this graphic organizer worksheet, students can record their own data on this tally chart/pictograph. There are two columns and six rows with room for a title.
Curated OER
Graphing With Candy
Students gather information and interpret the results using a tally chart, a table, and a bar graph.
Curated OER
Tally Time
Students create a tally chart. In this math and health lesson, students discuss healthy foods and create a tally chart showing the number of students who like to eat healthy foods.
Curated OER
Groundhog Day
Learners use the SMART Board to learn about Groundhog day and create a tally chart of predictions for whether he will see his shadow or not. In this Groundhog day lesson plan, students respond to questions throughout the instructional...
Curated OER
Organizing Data
In this tally chart worksheet, students complete a tally chart of the number of each animal they see in the picture and answer short answer questions about it. Students complete the chart for 5 animals and answer 3 questions.
Curated OER
Wordle It
Young scholars discuss, define, and give themselves character traits. In this character traits lesson plan, students create a list of ten character traits that describe themselves. Young scholars create a data table and poll their...
Curated OER
Graphing Data
First graders learn how to display data using a bar graph. In this bar graph lesson, 1st graders use data from a t-shirt color survey to make a bar graph. They also make an animal bar graph before interpreting the information.
Curated OER
Data Handling: Tally Chart on Illnesses
In this tally chart worksheet, students analyze a chart showing childhood illness cases. Students use the tally chart to solve 6 problems.
Curated OER
Tally Chart: Favorite Names
In this data display worksheet, students analyze a tally chart of favorite hamster names. Using the information on the chart, students solve 8 word problems.
Alabama Learning Exchange
What's Your Favorite Chocolate Bar?
Learners complete a math survey. In this math graphs lesson, students complete a survey about their favorite candy bars. Learners create different kinds of graphs using Microsoft Excel to show their results.
Curated OER
Tally Charts
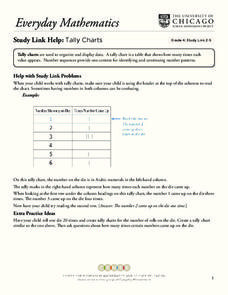
In this tally charts worksheet, students discuss how to use a tally chart and how to read the chart. Once students record information on a tally chart they answer questions showing their ability to read a tally chart.
Curated OER
Find Probability
For this probability worksheet, 4th graders answer 6 word problems using a tally chart that contains the results of rolling a dice that has the names of western states on it. They find the median, write fractions that show data, and...
Curated OER
Collect and Organize Data
In this data analysis learning exercise, 4th graders use a tally chart about favorite television programs. They record which are least or most popular, rankings, and combinations of programs.
Curated OER
Make a Tally
In this tally chart activity, learners read the word problems and use the information within the problem to make a tally chart. Students use the tally charts to help them finish and solve the word problem.
Curated OER
Collect and Organize Data: Homework
For this collecting and organizing data worksheet, students use the tally chart for the students' eye color to answer the first two questions. Students then survey their family for eye color, record those results in a tally chart, and...


