Curated OER
Ice Cream Scoop
For this data display worksheet, students write 6 flavors of ice cream on pieces of paper. Students choose papers one at a time and keep track on a tally sheet. Students make a bar graph of the results.
Curated OER
Tally Charts
In this math worksheet, students complete 4 tally charts. Students use a list of information, such as colors or types of fruit, to create the charts.
Curated OER
Dynamite Data
Second graders rotate through a variety of stations designed to offer practice in manipulating data. They sort, tally and count items and then create bar graphs, tables, and pie graphs to record their findings.
Curated OER
Tally Charts
In this tally charts worksheet, students fill in the tally chart with the item, tally, and number. Students have 2 tally charts to complete.
Curated OER
Organize Data
In this organizing data instructional activity, students complete the tally chart for 'Votes for Team Mascot' and then use the chart to answer the six questions.
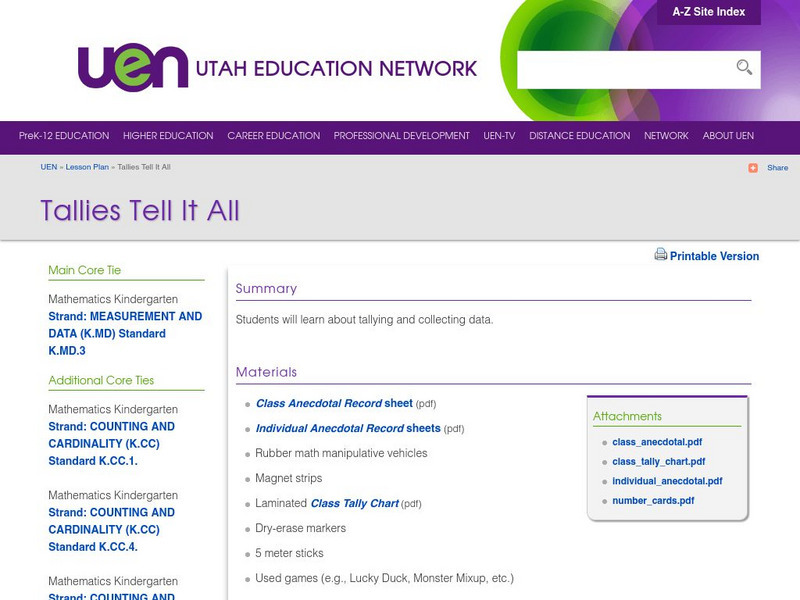
Utah Education Network
Uen: Tallies Tell It All
This math lesson plan engages students into mathematical activities. Students will learn about tallying and data collection.
ClassFlow
Class Flow: Tally Table Lessons
[Free Registration/Login Required] This flipchart contains interactive pages to help students learn how to read and interpret tally tables. There are 7 different tally table pages with questions. There are some blank tables at the end of...


