Curated OER
Village Research
Sixth graders research global warming. In this science lesson, 6th graders collect data in the Waterton Townsite, Apgar Village and St. Mary area. Students interpret the data and form a hypothesis about global warming.
Curated OER
Solar Hot Box
Young scholars investigate how different colors and materials create various temperatures and apply this it the concept of solar energy.
Curated OER
Graphs
In this temperature graphs activity, 6th graders complete word problems based on a temperature graph of a town. Students complete 5 problems total.
Curated OER
Tracking Fall's Falling Temperatures
Young meteorologists track weather from day to day and record results on graphs, maps, or other places. They see firsthand how weather temperatures trend cooler as fall progresses and practice grade-appropriate skills in geography (map...
Curated OER
The Urban Heat Island Effect - Lesson 2 (Grade 5)
Fifth graders use the scientific process to examine how when various surfaces are exposed to similar environmental conditions, surface temperatures may vary. They conduct an experiment to show the relationship between surface and...
Curated OER
Temperature (Celsius)
Third graders solve Celsius and Fahrenheit conversion problems, watch weather forecast and convert temperatures to Celsius, and design and present their own weather forecasts for different regions based on information gathered from...
Curated OER
Cool, Cold, Warm, or Hot Enrichment 18.5
In this temperature learning exercise, students solve 4 problems in which students study a picture of a seasonal activity. Students color the thermometer to show what the temperature might be and write the temperature on the line.
Curated OER
Using Integers To Show Differences
In this working with integers worksheet, students determine the change in temperature in each of 8 problems using integers. They use an integer line to find the differences in 5 problems.
Curated OER
Graphing Temperatures
Students identify current temperatures for different regions of the United States. Using current information, they develop hypothesis for the temperature in the same region tomorrow. They use the Weather Channel website to find actual...
Curated OER
Hotter or Colder
Students participate in an activity in which they determine the temperature. They are given different scenerios and they are to state whether it is hot or cold there and comparing it to other scenerios.
Curated OER
When You're Hot, You're Hot!
Eighth graders examine the development of the different temperature scales. They experiment with hot and cold temperatures.
Curated OER
TEMPERATURE
Third graders read a thermometer accurately, 3rd graders accurately record daily high and low temperatures found on Netscape on a line graph.
Curated OER
The Urban Heat Island Effect - Lesson 2 (Grades 8-9)
Students use the scientific process to show that when various surfaces are exposed to similar environmental conditions, surface temperatures may vary. They examine the "urban heat island" phenomenon and analyze why it increases energy...
Curated OER
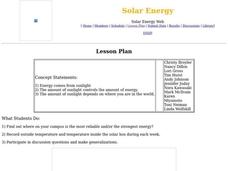
Solar Energy
Young scholars find out where on campus is the most reliable and/or the strongest energy, record outside temperature and temperature inside the solar box during each week, and participate in discussion questions and make generalizations.
Curated OER
Standard Deviation
Learners find city temperatures and analyze their means to find the standard deviation. They calculate the standard deviation of monthly temperature means.
Curated OER
School Temperatures
Young scholars collect and record temperatures throughout the school. Using this information they compare and contrast the temperatures recorded from various spots throughout the school.
Curated OER
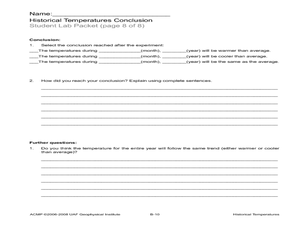
Historical Temperatures
Students research historical regional temperatures for their current season. In this historical weather instructional activity, students conduct weather station and Internet research to learn about historical regional temperatures....
Curated OER
Highs and Lows
Learners use email to chart weather patterns and then graph their findings. In this weather patterns lesson, students chart their weather for a week at the school. Learners then use email to find temperatures at a variety of locations....
Curated OER
The Effects of Temperature on Solids
Young scholars explore the effects that extreme temperatures have on the material properties of solids. They investigate the properties of a material whose state depends on extreme temperatures and witness how it interacts with room...
Curated OER
Here Comes the Sun
Third graders watch a video on the solar system and examine the role of the sun. As a class, they complete a KWL chart and make different color temperature pockets to use during their experiment. In groups, they make predictions about...
Curated OER
Comparing Temperatures in Different Cities
Pupils generate a spreadsheet to calculate average daily temperature. They create graphs from spreadsheet data and comprehend the components of the a spreadsheet.
Curated OER
Where Does Earth's Heat Come From?
Young scholars try to determine how the Earth is heated by the sun and other sources. In groups, they identify the other sources of energy and discover why different parts of the world are heated differently during the year. They...
Curated OER
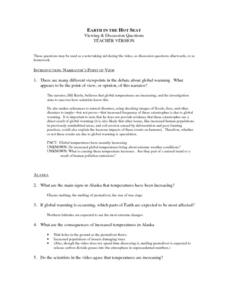
Earth in the Hot Seat
Young scholars identify the different viewpoints on the issue of global warming. While watching a video, they take notes on the issues presented to them and answer questions about what Alaska, Peru and East Africa are doing to prevent...
Curated OER
Why is the Average Temperature Greater on Venus than on Mercury?
Students examine the reasons why the temperature is higher on Venus than on Mercury. In groups, they analzye both planet's atmospheres and determine the rate of global warming on each. They use the internet to research the planets in...


