Curated OER
Random Probability
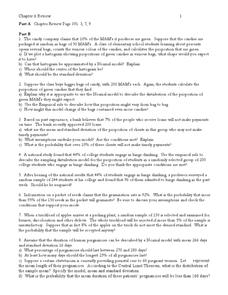
For this statistics and probability worksheet, young statisticians solve and complete 13 different problems related to probability, percentages, and normal distributions. They consider data models, assumptions about the models, and find...
Centre for Innovation in Mathematics Teaching
Ten Data Analysis Activities
This thirteen page data analysis worksheet contains a number of interesting problems regarding statistics. The activities cover the concepts of average measurements, standard deviation, box and whisker plots, quartiles, frequency...
Curated OER
The Bell Curve
Learners are introduced to the concepts of the normal curve, skewness and the standard deviation. They discuss how the normal distribution has been used and misused to support conclusions.
Curated OER
Empirical Rule Practice Problems
Using the empirical rule for a normal distribution, young statisticians determine the percent of adult women with given heights and weights. They find the percentile rank of a woman of a stated height and find the area under a curve.
Curated OER
Why NP Min?
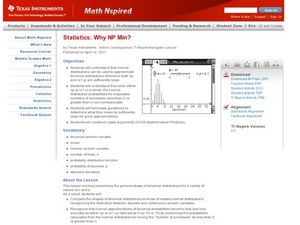
Pupils calculate the normal distribution. In this statistics lesson, students use the normal distribution to estimate binomial distributions. They define when to use NP and n(1-p) to make approximations.
Curated OER
Determine the 90% Values Given the 50% Values
In this normal distribution learning exercise, students determine the values for the middle 90% given the middle 50% values. Means and standard deviations are provided.
Curated OER
Normal Distribution
Students complete problems on normal distribution equations. In this algebra lesson plan, students complete 11 problems out of their text book.
Curated OER
The Normal Distribution
Students investigate normal distribution. In this statistical analysis lesson students investigate the variety of circumstances in which the normal distribution can be used. Students apply the normal distribution to solve...
Curated OER
Are Taxes "Normal?"
Students explore the concept of normal distribution. In this normal distribution lesson, students find the normal distribution of taxes in the 50 US states. Students make histograms, frequency tables, and find the mean and median of tax...


