Texas Instruments
Endothermic and Exothermic Processes
Young scholars investigate temperature using the TI. In this chemistry lesson, students analyze the change in temperature, as chemicals are dissolved in water. They analyze data collected using the CBL 2.
Curated OER
Algebra 1: Slope as Rate
Students solve problems with slopes. In this algebra instructional activity, students identify the slope of a line and relate it to the rate of change. They graph their lines on the TI and observe changes in the lines.
Curated OER
How Many Solutions to the System?
Solve systems of equation using graphing! In this algebra activity, high schoolers use the TI to graph two lines and identify the number of solutions. They perform interactive graphing on the navigator.
Curated OER
Area "FOILed" Again!
Learners perform factoring on the TI. In this algebra instructional activity, learners factor equations using the FOIL method. They use the TI navigator to show each step using a visual.
Curated OER
Charging Up, Charging Down
Learners collect and analyze voltage data. Then, they investigate exponential functions using the TI and a Voltage Probe and graph their data and analyze it using a table.
Curated OER
Graphing Quadratic Functions
Pupils explore quadratic functions in this algebra instructional activity. They investigate transformation of quadratic functions using the TI calculator. They use the vertex form for this instructional activity.
Curated OER
Reflecting a Triangle in the Coordinate Plane
Learners explore geometric concepts using technology. They manipulate the TI to find important math topics. This activity requires a TI-84 or higher.
Curated OER
NUMB3RS - Season 3 - "Provenance" - Set the Trap
Learners investigate concept of matrices through iteration in this probability lesson. They investigate probability by creating a lesson based on a famous painting. This assignment contains extensions to the...
Texas Instruments
Cabri Jr. Inscribed and Central Angles
Learners will differentiate between inscribed and central angles in this geometry lesson. They answer questions dealing with circles as they relate to inscribed triangles and angles. This assignment includes a printable worksheet.
Curated OER
Betweenness and the Sum of Parts
High schoolers differentiate lines and angles using betweenness in this geometry lesson. They differentiate angles and lines using Cabri Jr. and analyze the data and make conjecture.
Curated OER
TI Workshop Presentation Guide for "Preparing for Proofs"
Pupils discover proofs using the TI in this geometry lesson. They collect data from newspaper and magazines and analyze their data using the TI, relating it to proofs.
Texas Instruments
Measuring Air Pressure Lab
Your class can investigate the weather through an experiment. In this chemistry lesson, learners collect data on air pressure and relate it to the weather. They collect data with the TI containing a barometer probe.
Curated OER
Visualizing Integers
Students create visuals on the TI Calculator to solve problems. In this algebra lesson, students perform basic operations with integers. They add, subtract, multiply and divide.
Curated OER
Elements of a Short Story
Students analyze elements of a short story by working together. In this literature lesson plan, students analyze short stories. They use the TI Navigator Application to write their findings.
Texas Instruments
Say What You Mean!
Learners analyze data and identify the mean. In this probability lesson, students log data in the TI and construct scatter plots from the data. They identify properties of a scatterplot.
Texas Instruments
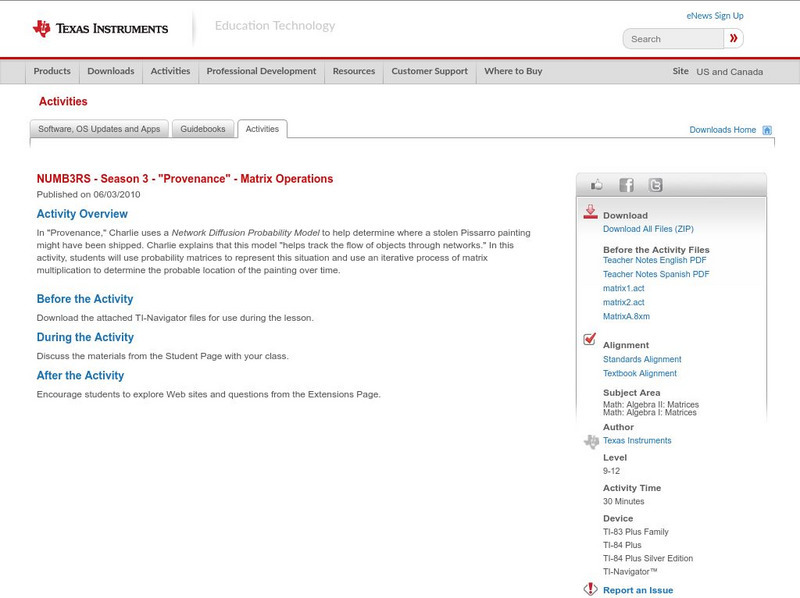
Texas Instruments: Numb3 Rs: Matrix Operations
Based off of the hit television show NUMB3RS, this lesson shows students how using matrix multiplication can lead to solving real-world problems. In this situation, a painting is missing and the probability of travel betweek five cities...
Texas Instruments
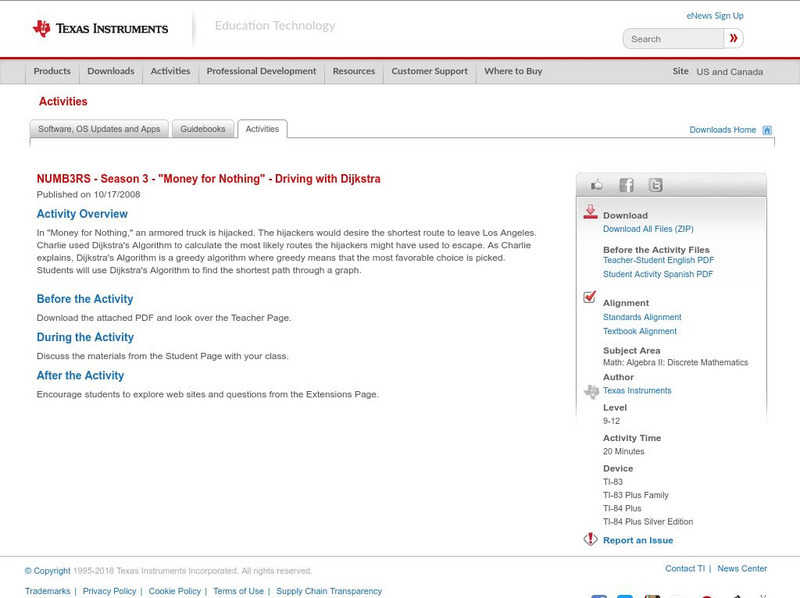
Texas Instruments: Numb3 Rs: Driving With Djikstra
Based off of the hit television show NUMB3RS, this lesson introduces students to one of the prominent algorithms in graph theory used to find shortest paths -- the Djikstra Algorithm. The lesson includes four graphs of increasing...
Study Languages
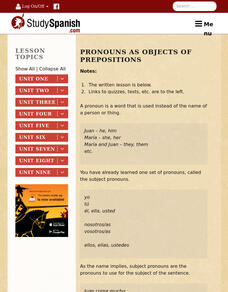
Study Spanish: Pronouns as Objects of Prepositions
This site is an explanation of prepositional pronouns with a list of prepositions that only take subject pronouns. Great lesson for understanding prepositional pronouns. Students may check test their mastery of this principle with a quiz...
Web Elements
Web Elements Periodic Table: Titanium
This site provides a great deal of elemental information about titanium. There are audio files demonstrating the correct pronunciation of the element name, pictures showing the electron shells, and information on isotopes, properties and...
Texas Instruments
Texas Instruments: Numb3 Rs: Expected Value
Based off of the hit television show NUMB3RS, this lesson attempts to explain the betting system at horse tracks by having learners vie for parcels of land on their calculators. Because the land boundaries are unknown until the finale of...
St. Charles Place Education Foundation
Reading Bear: Si, Su, Ci, Ti, Tu Lesson
In this beginning reading module, the instructor models how to pronounce words that incorporate "si", "su", "ci", "ti", or "tu" in them. Students are prompted to with the video segments at various times. Students can choose to sound out...
University of Kentucky
Uk: Titanium Comics
Although this page focuses more on fun than on facts, it will quickly become a favorite of most Chemistry students. Find scanned panels and pages of comic books with elemental characters.
Texas Instruments
Texas Instruments: Biggest Box
A classic problem looking at maximizing volume by varying the height of a box. Uses graphing calculators to analyze data collected and to model a cubic equation. Look for points that maximize volume while developing a preliminary notion...
Texas Instruments
Texas Instruments: Get on the Stick
In this activity, students use a CBR 2 to measure the reaction time of catching a stick. They also learn how to interpret a box plot, and make a five number summary of a single variable data set.


