Texas Instruments
Texas Instruments: Give Me a Hand or Leaf Me Alone
In this activity, students' find the surface area of geometric shapes cut from card paper and relate it to its mass. They use this data to find the surface area of irregularly shaped objects.
Texas Instruments
Texas Instruments: Solving a System of Two Equations Graphically
This video tutorial shows you how to find the solution of two equations by using the Intersect command on the graph screen.
Texas Instruments
Texas Instruments: Pumpkin Graph an Activity for Plotting Points
Students are given 3 - 4 points to plot in activity center. Students practice plotting points an can review the coordinate plane.
Texas Instruments
Texas Instruments: Numb3 Rs: Ants Go Marching
Based off of the hit television show NUMB3RS, this lesson has students experiment and make observations on a directed graph. The lesson is framed in the context of an ant colony which is in search of the best path to get to food. If an...
Texas Instruments
Texas Instruments: What's the Spin?
Students discover properties of rotations using the TI-89 and CABRI Geometry II by rotating a triangle around a point and through a specified angle. They will discover the definition of a rotation. [Requires Adobe Reader.]
Texas Instruments
Texas Instruments: Mc Dougal Littell Geometry: Investigate Slopes
Students can use the TI-84 Plus family with Cabri Jr. to investigate properties of parallel lines.
Texas Instruments
Texas Instruments: Video Tutorial Installing Apps Into Ti Smart View
This tutorial shows you how to install Apps and new operating systems in the TI-SmartView software.
Texas Instruments
Texas Instruments: Finding the Maximum Product
In this activity, students use the CellSheet Application to organize data. They solve a problem of finding two positive integers equal to or greater than zero with a given sum and the maximum product.
Texas Instruments
Texas Instruments: Measures of Central Tendency
Mean, median, and mode are measures of central tendency in data analysis. Each can be used to identify central tendency. Box-and-whiskers plots are a visual representation of collected data involving medians.
Texas Instruments
Texas Instruments: Michigan Meap Practice Exams Math
Students can use these LearningCheck item banks to prepare for the following - 11th grade MEAP math exam.
Texas Instruments
Texas Instruments: Covalent Bonding
This activity helps students review basic covalent nomenclature.
Texas Instruments
Texas Instruments: Mm Cas 2002 Exam 1 Part 1 : Sample Solutions Q1 & Q7
Students use the Derive software to solve problems on trigonometric functions.
Texas Instruments
Texas Instruments: Simultaneous Equation Solver App
Students use this App to calculate solutions (a unique solution, no solution, or an infinite number of solutions.unique) for linear systems. They can work with systems that contain both numeric and symbolic coefficients and have up to 30...
Texas Instruments
Texas Instruments: Numb3 Rs: How Hard Can It Be?
Based off of the hit television show NUMB3RS, this lesson introduces students to one way of defining the strength of an encryption (called "Entropy"). In the lesson, students learn how to calculate the entropy of a given code, and then...
Texas Instruments
Texas Instruments: Numb3 Rs: A Pursuit Curve Problem
Based off of the hit television show NUMB3RS, this lesson introduces students to pursuit curves, in which objects follow seemingly awkward paths due to other objects chasing it. In this lesson (which is technology intensive), students...
Texas Instruments
Texas Instruments: Statistics Pretest
This is a pre-test for a statistics class. Since most systems want data driven analysis, this is a great way to get data at the beginning of the course on how much students know about statistics.
Texas Instruments
Texas Instruments: 3.14159265
In this activity, students investigate the circumference of circles and learn about the irrational number Pi.
Texas Instruments
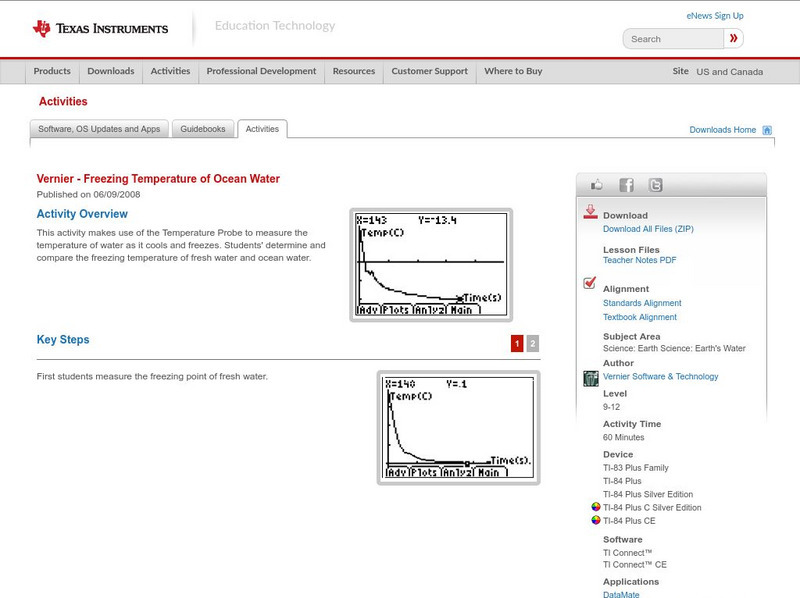
Texas Instruments: Freezing Temperature of Ocean Water
This activity makes use of the Temperature Probe to measure the temperature of water as it cools and freezes. Students' determine and compare the freezing temperature of fresh water and ocean water.
Texas Instruments
Texas Instruments: The Slope of the Tangent Line (Part1)
In this activity, students use the CellSheet Application to approximate the slope of a line tangent to a curve.
Texas Instruments
Texas Instruments: Integer Subtraction What's the Difference?
In this activity, students use the number line to investigate subtraction of integers and to justify and support the rules they develop.
Texas Instruments
Texas Instruments: Cabri Geometry Tour
In this activity, students use the Cabri software to mark points, draw lines, construct parallel and perpendicular lines, angles, bisectors, and triangles. They learn how to use the tool to measure angles.
Texas Instruments
Texas Instruments: Maryland Msa Practice Exam Grade 6 8 Math
Students can use these LearningCheck? item banks to prepare for the Maryland MSA exams.
Texas Instruments
Texas Instruments: Walking the Line
In this activity, students use linear functions to model and solve problems in situations with slope and a constant rate of change. They learn to represent situations with variables in expressions, equations, and inequalities and use...
Texas Instruments
Texas Instruments: Glencoe Pre Algebra: Graphing Calculator: Mean and Median
Students will find the mean and median of a set of data.


