Center for Innovation in Engineering and Science Education, Stevens Institute of Technology
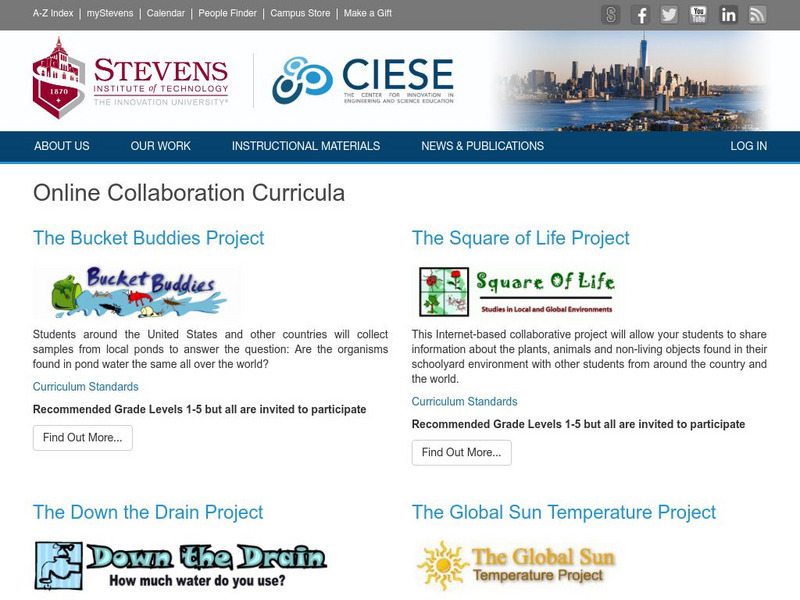
Ciese: Collaborative Projects
Using a variety of science topics, these projects link your class with classes around the world in data collection and analysis. There are projects recommended for all grade levels. Begin dates and end dates are listed to help in...
Online Writing Lab at Purdue University
Purdue University Owl: Analysis
This entry focuses on using analysis to interpret primary resources; it provides methods and examples of analysis. W.9-10.10 Write Routinely
Cuemath
Cuemath: Stem and Leaf Plot
A comprehensive guide for learning all about stem and leaf plots with definitions, how to construct them, solved examples, and practice questions.
Cuemath
Cuemath: Frequency Distribution Table
A comprehensive guide for learning all about frequency distribution tables with definitions, how to create a frequency distribution table, and the formulas and graphs related to frequency distributions. With solved examples and...
Houghton Mifflin Harcourt
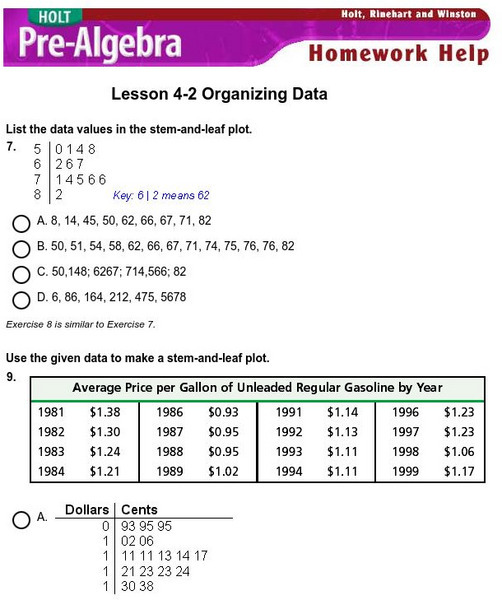
Holt, Rinehart and Winston: Homework Help Independent Practice: Stem and Leaf Plot
Get independent practice organizing data and using stem-and-leaf plots. Each incorrect response gets a text box explanation and another try. Correct responses are confirmed.
Cyberbee
Adventures of Cyberbee: Graphing
Teacher-directed lesson plan focusing on data analysis, graphing, and probability. Lesson includes a video and engaging spreadsheet activities.
US Department of Education
Nces Kids: Creating an Area Graph
This is where you will find step by step directions explaining how to create an area graph. Complete each step and click on the next tab. Directions are simple and clear.
National Council of Teachers of Mathematics
The Math Forum: Seventh Grade Mathematics: Data Sense
This site has some interesting ways to collect and evaluate data. There are some activities about note taking, spreadsheets, surveys, and a cool bridge construction project. Teachers may want to use this site as a resource for some...
Texas Instruments
Texas Instruments: Finding the Maximum Product
In this activity, students use the CellSheet Application to organize data. They solve a problem of finding two positive integers equal to or greater than zero with a given sum and the maximum product.
Texas Instruments
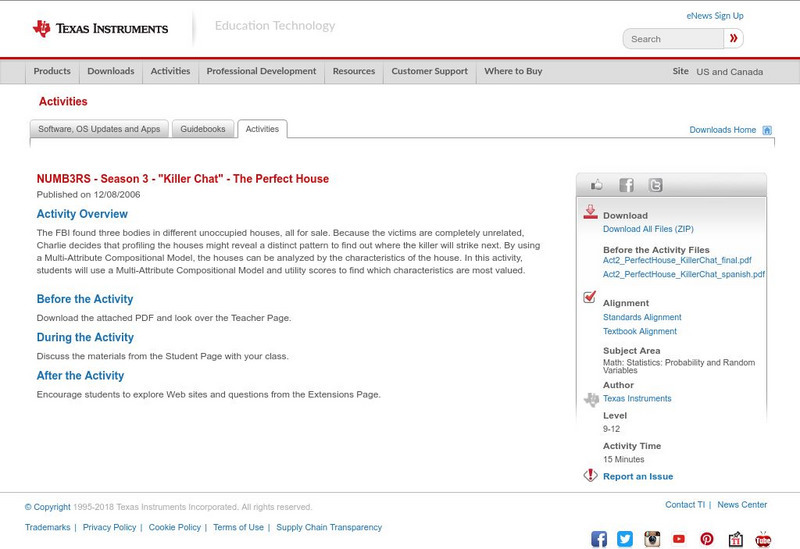
Texas Instruments: Numb3 Rs: The Perfect House
Based off of the hit television show NUMB3RS, this lesson introduces students to the concept of Multi-Attribute Compositional Models, in which market experts determine what features are most in demand for a given product. The lesson is...
Texas Instruments
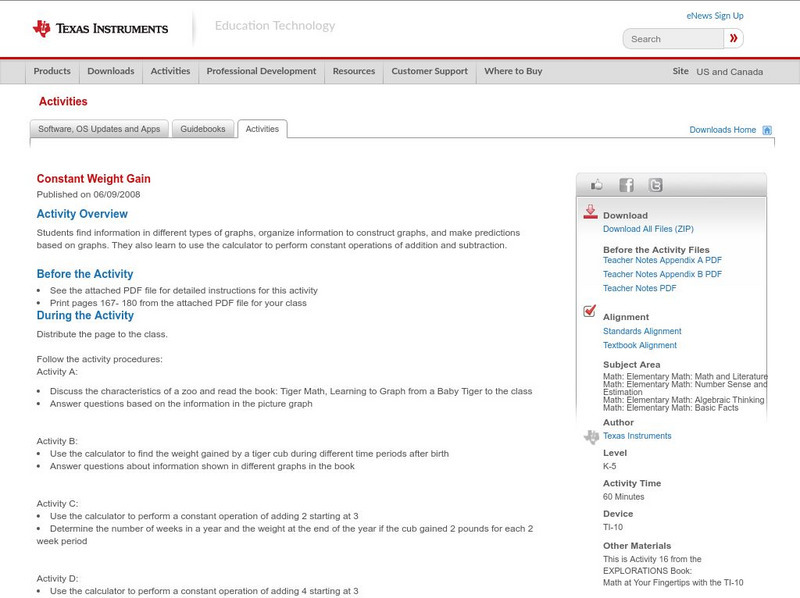
Texas Instruments: Constant Weight Gain
In this activity, students find information in different types of graphs, organize information to construct graphs, and make predictions based on graphs. They also learn to use the calculator to perform constant operations of addition...
Other
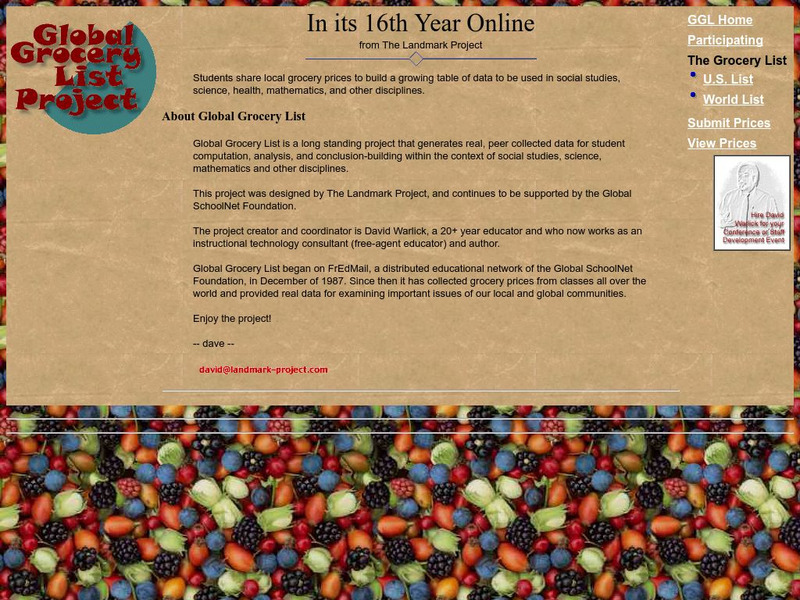
Global Grocery List Project: Homepage
At this site from the Global Grocery List Project, students collect data on the prices of common grocery items and submit their findings. They can then compare the data they collected to data from students around the world. There are...
Mangahigh
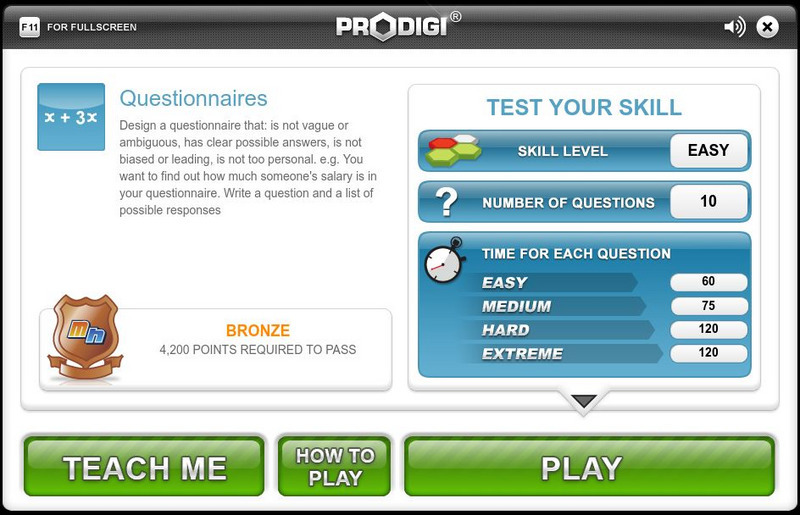
Mangahigh: Data: Questionnaires
Students learn about the concept of collecting data using questionnaires by exploring a tutorial. They can then test their knowledge by taking a ten question assessment that increases in difficulty as they correctly answer questions.
National Council of Teachers of Mathematics
Nctm: Figure This: Does Drinking Soda Affect Your Health?
Try this "Real world," challenge taken directly from the today's health journals. Use your problem solving, data analysis, and number sense skills to figure out if soda intake among teenage girls is related to incidences of broken bones....
Oswego City School District
Regents Exam Prep Center: Categorizing Data
Three lessons on different types of data (qualitative, quantitative, univariate, bivariate, biased data) as well as a practice activity and teacher resource.
National Council of Teachers of Mathematics
Nctm: Figure This: Census
Try this real world challenge that focuses on data collection, data analysis, and problem solving with information from the U.S. Census Bureau. Discover how these skills are applied in real life situations in this one page activity from...
Rice University
Rice University: Cynthia Lanius: Fun and Sun Rent a Car
A wide range of math skills is incorporated into a lesson that involves planning a family's vacation to Florida. Travel expenses are gathered and compared, graphed, and analyzed in hopes of finding the best prices. There are extension...
National Center for Ecological Analysis and Synthesis, University of California Santa Barbara
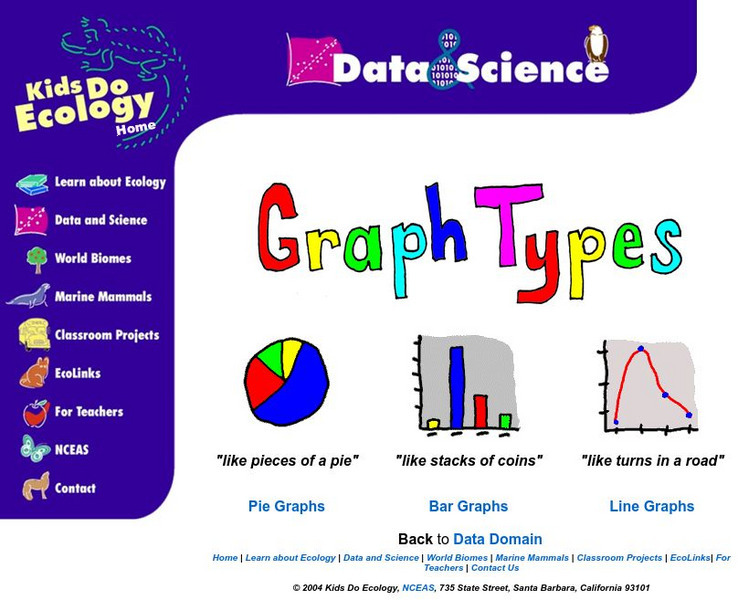
Nceas: Graph Types
At this site from NCEAS you can learn how to organize your data into pie graphs, bar graphs, and line graphs. Explanations and examples are given of each graph along with several questions that check comprehension.
Oswego City School District
Regents Exam Prep Center: Multiple Choice Practice: Working With Data
Test your knowledge of working with data by taking this twenty question multiple-choice practice test. Use a graphing calculator to help with any graphing problems and check your answers at any given time throughout the test.
National Council of Teachers of Mathematics
Nctm: Figure This: Do Women Live Longer Than Men?
Use this site to figure out if women really do live longer than men. A math challenge taken from today's health journals that explores data collection, data analysis, patterns, and graphing skills. Learn how mastering these skills can be...
Education Development Center
Tune in to Learning: Reading Charts and Graphs
Practice graph reading skills with these exercises and companion tutorials.
University of Waterloo (Canada)
Wired Math: Organizing Data Grade 7 [Pdf]
A collection of worksheets that focus on data analysis and organizing data. Includes detailed examples, colorful visuals, and a link to a related game. Acrobat Reader required.
Other
Welcome to mr.r's World of Math!!!
At this site, math word problems are presented in an exciting and creative format. Students attempt to find solutions to hilarious situations using their mathematical skills. To do this they must solve various math problems in a certain...
Other
Brebeuf Jesuit Preparatory School: The Scientific Method (Part 3) [Pdf]
Explains how to collect and organize data for an experiment. Describes how to make a table and graph the data, and when to use different types of graphs. Next, it discusses which variable should be on the x- or y-axis of a graph, and how...


