US Department of Education
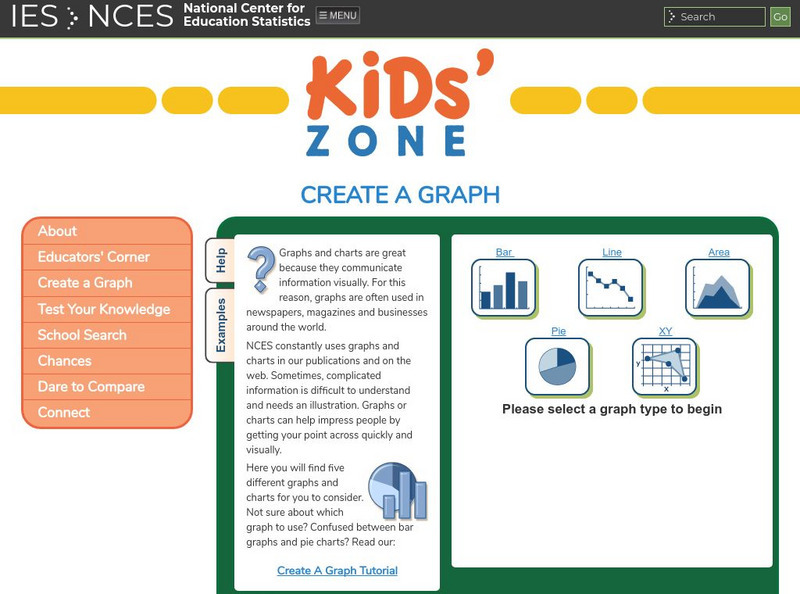
Nces Kids: Create an Xy Graph
This is where you can find a step by step explanation of how to create an XY graph. When you finish each step just click the next tab and you will find the next set of instructions.
TED Talks
Ted: Ted Ed: David Mc Candless: The Beauty of Data Visualization
Listen and watch as David McCandless turns complex data sets into beautiful, simple diagrams. He suggests that information design is really important because we all like to visualize our information. [18:19]
Quia
Ixl Learning: Scatter Plots
Brush up on your math skills relating to scatter plots then try some practice problems to test your understanding.
Scholastic
Scholastic: Math Maven's Mysteries: The Case of the Dastardly Disguiser
Famous jewels have been stolen from the Country Music Hall of Fame! The Dastardly Disguiser is a suspect, but we need to find out just how many disguise combinations he can use.
Math Slice
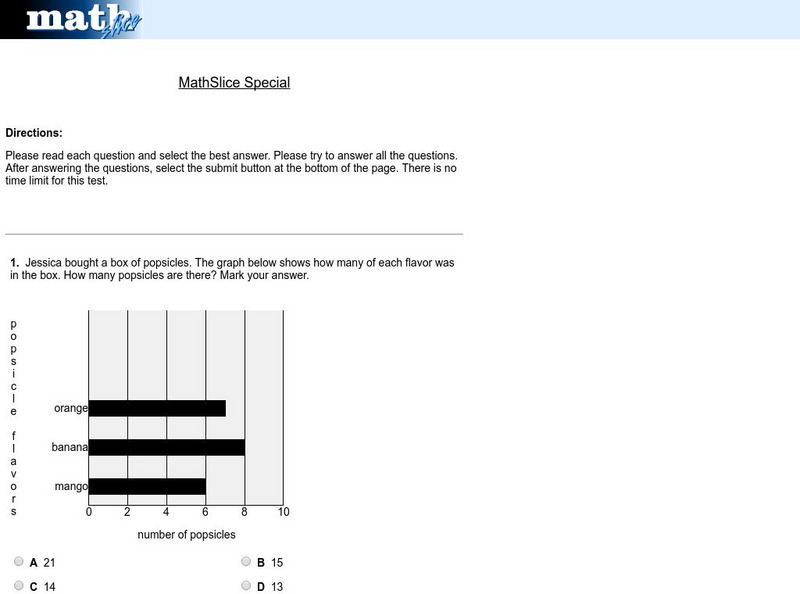
Math Slice: Chart Slice Special Test
A ten question test assessing data collection and analysis skills with bar graphs. Assessment is scored online. An excellent tool for assessment.
PBS
Pbs Teachers: Sports and Math: Batting Averages and More
Set up a spreadsheet using a computer or graphing calculator, and perform calculations using columns. Calculate percentages and solve a system of equations regarding baseball statistics.
Houghton Mifflin Harcourt
Houghton Mifflin Harcourt: Saxon Activity Center: Real World Investigation: Elevation Changes [Pdf]
Math and geography are the focus of this internet investigation. Learners must plan a road trip to several cities and plot the elevations of those cities using a line graph. Acrobat Reader required.
ClassFlow
Class Flow: Organizing Data in Matrices
[Free Registration/Login Required] This lesson looks at organizing data into a matrix, as well as identifying the different elements in a matrix.
ClassFlow
Class Flow: Collecting and Analyzing Data Using Pedometers
[Free Registration/Login Required] Students will collect and analyze data after wearing a pedometer. They will record data, make a personal bar graph and a class graph. Activotes are used to analyze and discuss the data.
University of Cambridge
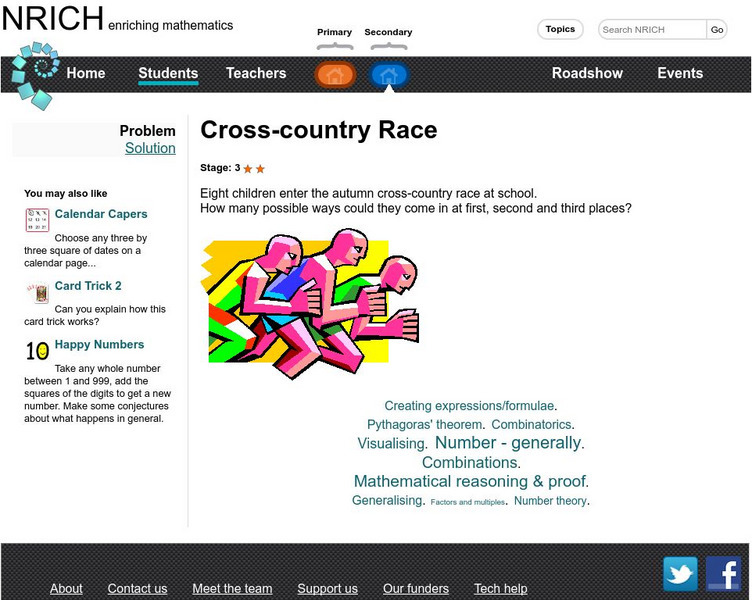
University of Cambridge: Nrich: Cross Country Race
On this one page website sharpen your logic and problem solving skills while working on this challenge. The solution is available to double check your solution.
University of Cambridge
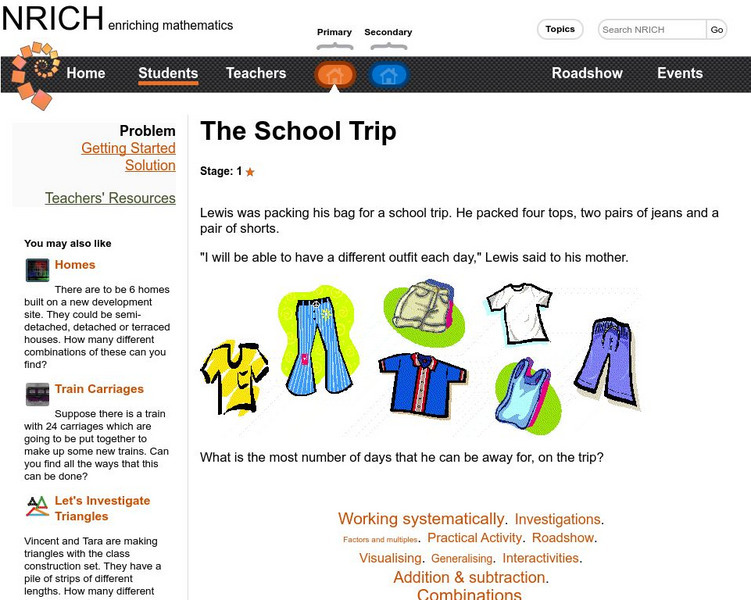
University of Cambridge: Nrich: Packing for the School Trip
Help Lorenzie figure out how many combinations he can make with the pants and shirts he is packing. Check the website for the solution.
University of Cambridge
University of Cambridge: Nrich: Arranging the Tables
On this one page website sharpen your logic and problem solving skills while working on this challenge. The solution is available to double check your solution.
University of Cambridge
University of Cambridge: Nrich: Good Work if You Can Get It
On this one page website sharpen your logic and problem solving skills while working on this challenge. The solution is available to double check your solution.
National Council of Teachers of Mathematics
Nctm: Figure This: Rose Bowl
A math challenge taken directly from the sports pages. Use your problem solving and data collection aptitude to find out how many different ways a Rose Bowl team could score 11 points. Try this one page activity from the NCTM Math...
Rice University
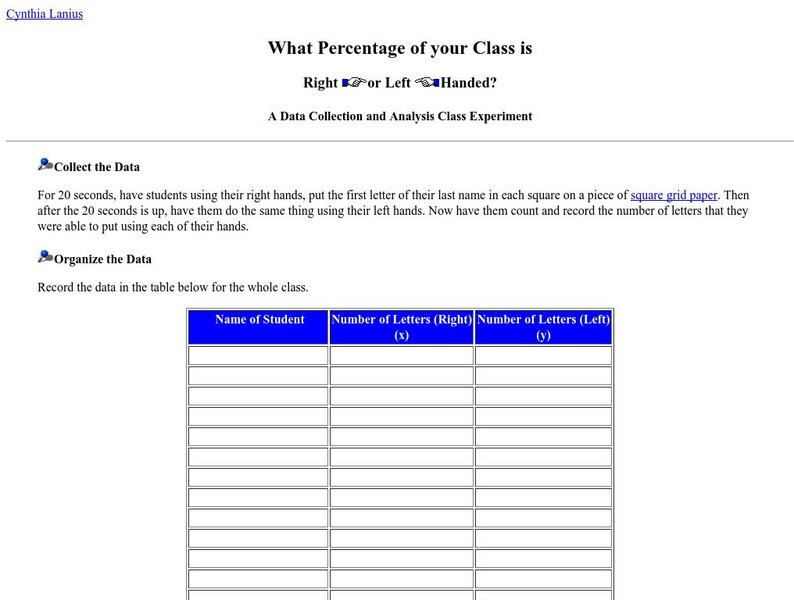
What Percentage of Your Class Is Right or Left Handed?
What percentage of the class is right or left-handed? Students will investigate this question using statistical processes of collecting the data, organizing it, graphing, and finally analyzing it. Follow-up questions are provided for the...
Rice University
Rice University: The Hand Squeeze
Students will enjoy this data collection and class analysis experiment involving the time it takes for a hand squeeze to travel around a circle of people. From organizing the activity to collecting the data to making a table and graphing...
National Council of Teachers of Mathematics
Nctm: Figure This: Basketball Picks
A math challenge taken from the NBA that is sure to interest true basketball fans. Use your data collection, organization, and analysis skills to figure out which teams play each other. A one page NCTM Math Challenges for Families...
National Council of Teachers of Mathematics
Nctm: Figure This: Is There Room for All These Gifts?
This math challenge activity focuses on the concept of organizing information. Test your problem-solving aptitude as you try to figure out who received the most gifts.
Other
Math Stories: Make a Table
At this one page site you can work through step by step a sample problem that illustrates the problem solving strategy for "Make a table." The answer is right there to help you check your thinking.
Other
Math Stories: Make a List
At this one page site you can work through step by step a sample problem that illustrates the problem solving strategy for "Make a list." The answer is right there to help you check your thinking.


