Curated OER
Influence and Outliers
Using the TI-Nspire calculator, statisicians identify outliers and their effect on the least-squares regression line. In finding the line of best fit, they determine what points will affect the least squares regressions and what points...
Curated OER
Comparison of Univariate and Bivariate Data
Learners explore the concept of univariate and bivariate data. In this univaritate and bivariate data lesson, pupils discuss the differences between univariate and bivariate data. They work sample problems where they must construct box...
Wolfram Research
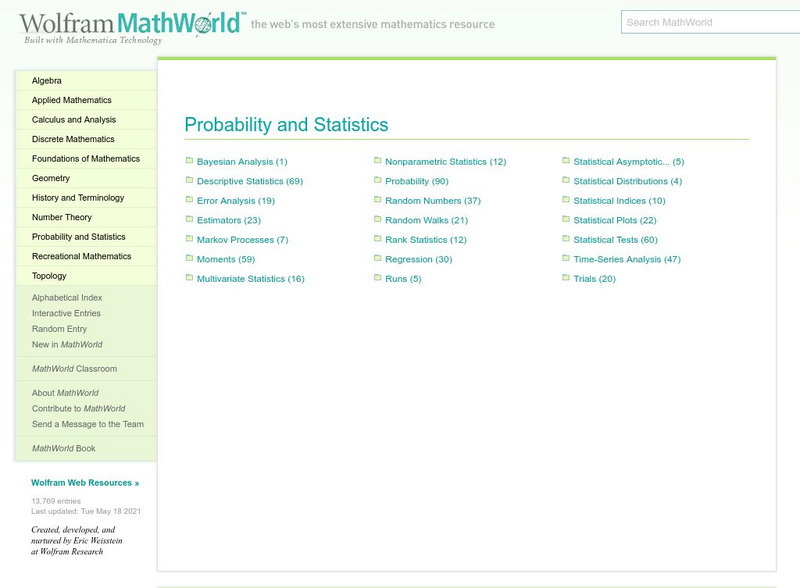
Wolfram Math World: Probability and Statistics
This is a resource for many topics in probability and statistics. Click on the topic of your choice for an explanation. The sites you will be linked to are quite extensive. A degree of higher-level math is necessary for understanding...
Texas Instruments
Texas Instruments: Comparing Distributions of Univariate Data
Students compare univariate data distributions using statistical concepts like box plots, stem plots, and histograms.
Texas Instruments
Texas Instruments: Summarizing Distributions of Univariate Data
Students understand statistical concepts like center of data and the amount of data variation from the center. They calculate the measures of the center of a distribution and the measures of spread for the data collected as a list....
Texas Instruments
Texas Instruments: Distributions and Univariate Data
This set contains statistics questions comparing distributions of univariate data. The student is asked to note the differences between distributions regarding center, shape, spread, and existence of outliers.
CK-12 Foundation
Ck 12: Summary Statistics: Summarizing Univariate Distributions
[Free Registration/Login may be required to access all resource tools.] This concept teaches students about other measures of center such as the mid-range, trimmed means and weighted mean. It also introduces the concept of percentiles,...
CK-12 Foundation
Ck 12: Statistics: Displaying Univariate Data
[Free Registration/Login may be required to access all resource tools.] This Concept shows student how to make stem-and-leaf plots as well as dot plots in order to display data with one variable.
Shodor Education Foundation
Shodor Interactivate: Comparison of Univariate and Bivariate Data
Young scholars learn about the difference between univariate and bivariate data and understand how to choose the best graph to display the data.
Shodor Education Foundation
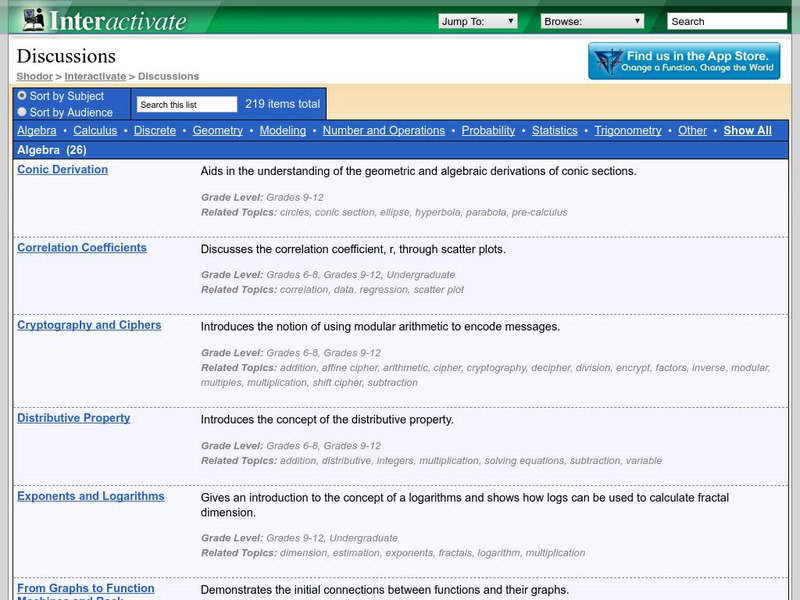
Shodor Interactivate: Stats and Probability Concepts
Many topics on Statistics and Probability are defined and linked here. Click on any of them to move to a more detailed discussion of the term.


