Curated OER
Introduction to Measures of Central Tendency and Variability
Students calculate the mean, median, mode, range, and interquartile range for a set of data. They create a box and whisker plot using paper, pencil and technology.
Curated OER
Sexual Reproduction and Meiosis
In this biology worksheet, 9th graders create one chromosome using a red plasticine and another using blue plasticine. Then they illustrate different ways of crossing over, including double crossovers. Students also explain genetic...
Curated OER
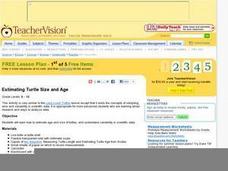
Estimating Turtle Size and Age
Students investigate how to estimate the age and size of turtles, and examine variability in scientific data. They read an informational handout, identify the parts of the shell, measure the shell and estimate the age, and record the...
Google
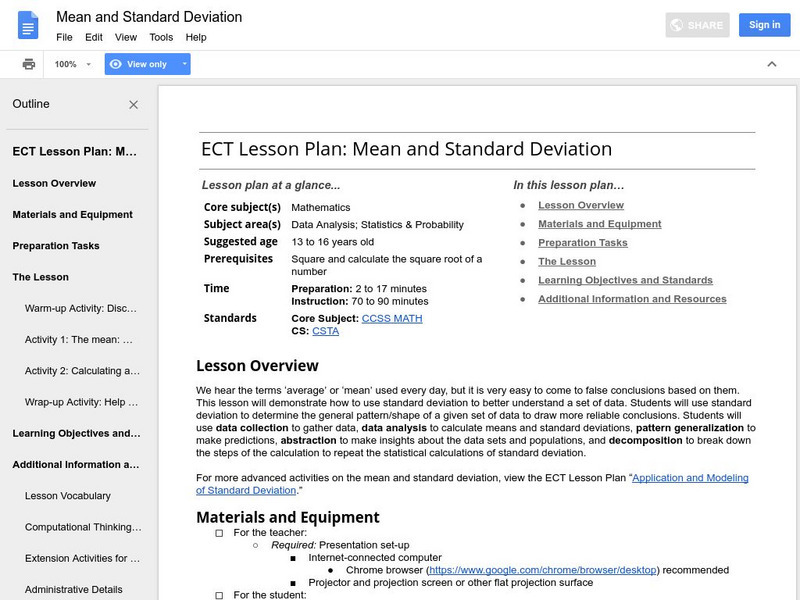
Google for Education: Mean and Standard Deviation
This lesson demonstrates to young scholars how to use standard deviation to better understand a set of data. Students use standard deviation to determine the general pattern or shape of a given set of data to draw more reliable conclusions.
Missouri State University
Missouri State University: Introductory Statistics: The Normal Curve
Provides lengthy explanations of the measures of central tendencies - mean, mode, and median - and the measures of variability - range, variance, standard deviation - are given here. Graphs of interesting "side items" are presented as...
BSCS Science Learning
Bscs: Globe at Night Dark Skies
For this inquiry, students predict the best place to stargaze in Arizona based on the brightness of the night sky. Students are introduced to the concept of light pollution and Globe at Night, a global citizen science project in which...
BSCS Science Learning
Bscs: Budburst Lilac Festival
In this Inquiry, learners predict the best date to host a lilac blossom festival so that lilacs are in full bloom in the city where students live. Learners are introduced to Project Budburst, a citizen science project in which volunteers...
BSCS Science Learning
Bscs: Globe at Night Dark Skies
In this inquiry, students predict the best place to stargaze in Arizona based on the brightness of the night sky. Students are introduced to the concept of light pollution and Globe at Night, a global citizen science project in which...
Houghton Mifflin Harcourt
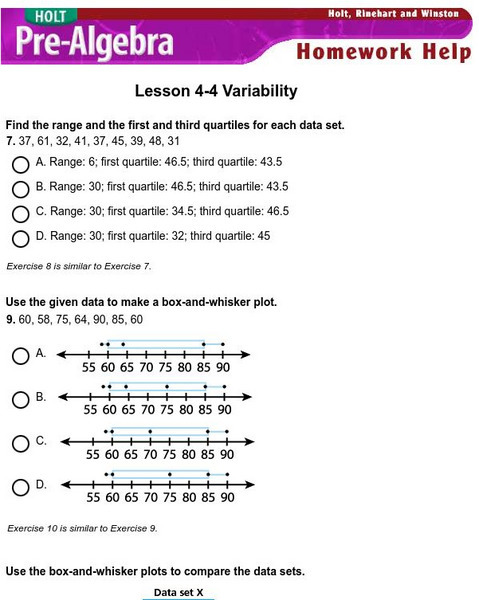
Holt, Rinehart and Winston: Homework Help Independent Practice: Variability
Get independent practice working with variability. Each incorrect response gets a text box explanation and another try. Correct responses are confirmed.
City University of New York
Measures of Variability
Explanation and examples of variance and standard deviation. Helpful charts and formulas are provided.
Space Telescope Science Institute
Amazing Space: Galaxy Hunter
Journey to the wildest regions of space, and wrestle with cosmic giants, galaxies. Explore the Hubble Deep Fields from a statistical point of view.
Other
Conservation Ecology: Assessing Extinction Risk
This site discusses how genetic variability is correlated with the risk of organism extinction. It also discusses how bottlenecks can reduce genetic variability in populations leading to extinctions.
Other
Perkins School for the Blind: What Is a Statistical Question?
This is a lesson with a worksheet that defines the key elements of statistical questions.
Soft Schools
Soft Schools: Diversity Quiz
Take this interactive, multiple-choice quiz over ecological biodiversity, then review your score and any missed questions at the end.
Illustrative Mathematics
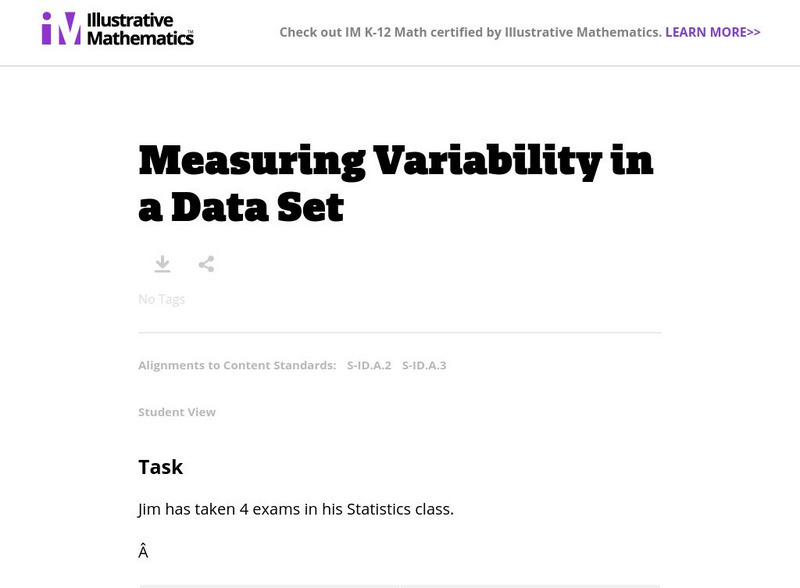
Illustrative Mathematics: Measuring Variability in a Data Set
The purpose of this student task is to develop understanding of standard deviation. Aligns with S-ID.A.2 and S-ID.A.3.
Louisiana Department of Education
Louisiana Doe: Louisiana Believes: Eureka Math Parent Guide: Statistics
A guide to support parents as they work with their students with statistics.
Other
Fayetteville State Univ.: Analysis of Variance (Anova)
A brief discussion of ANOVA, statistical Analysis of Variance, where the variability between two conditions is observed. An example is provided to assist the user in understanding.
National Council of Teachers of Mathematics
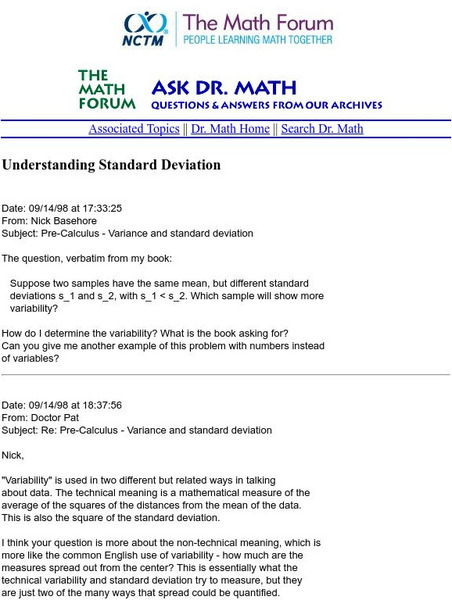
The Math Forum: Understanding Standard Deviation
MathForum answers a question on variance and standard deviation.


