Curated OER
Magnetic Storms
In this magnetic storms worksheet, students use a graph of data collected over time showing the magnitude of a magnetic storm. Students use the data to solve 6 problems about the graph and they determine the strength of the storm at...
Curated OER
Using the Balance
Students determine the mass of various objects. In this integrated math and science lesson, students use an arm balance to compare a known object to a combination of washers with a fixed weight. Students record data, construct a bar...
Curated OER
Human Population Growth
For this human population growth worksheet, students create a graph of human population growth and predict future growth using the data given in a chart. Students identify factors that affect population growth.
Curated OER
Learn How to Graph
Students examine various types of charts and discover how to construct a line graph. Using graph paper, they construct a graph displaying weight loss over a five-year period. They draw copnclusions from the completed graphs.
Curated OER
Creating Bar Graph
Seventh graders, after an explanation and demonstration compare how many different places there at Cocowalk.
Khan Academy
Khan Academy: What Are Velocity vs. Time Graphs?
Graphs and examples help explain what the vertical axis, slope, and area represent on a velocity-time graph.
Physics Classroom
The Physics Classroom: Image Formation by Lenses
This lesson explains what lenses are, the different between a converging and diverging lens, the difference between a double convex and double concave lens, and gives definitions for terms related to lenses.
Northeast Parallel Architectures Center, Syracuse University
Npac Reu Program: Slope & Line Equations
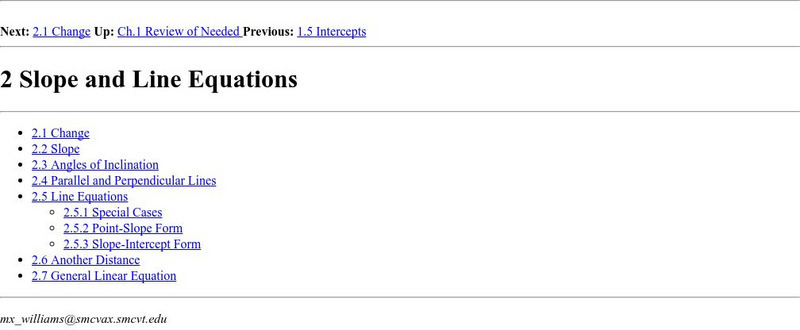
This site from the Northeast Parallel Architectures Center, Syracuse University has a very substantial discussion of math topics slope & line equations. The outline form is quite useful if you need to zero in on one aspect of...
Analyze Math
Analyze Math: Vertex and Intercepts Parabola Problems
The tutorial explores the vertex and intercepts of parabolas. Some topics discussed are vertex form, vertical axis, intercepts, and graphing. The activity consists of examples with detailed solutions.
The Math League
The Math League: Using Data and Statistics
This site contains two short examples of line graphs, charts that show change over time. This is a quick introduction to the topic of statistical graphing.
Houghton Mifflin Harcourt
Houghton Mifflin Harcourt: Saxon Activity Center: Real World Investigation: Elevation Changes [Pdf]
Math and geography are the focus of this internet investigation. Learners must plan a road trip to several cities and plot the elevations of those cities using a line graph. Acrobat Reader required.


