National Research Center for Career and Technical Education
Finance: Depreciation (Double Declining)
Of particular interest to a group of business and finance pupils, this lesson explores depreciation of automobile values by comparing the double declining balance to the straight line method. Mostly this is done through a slide...
Curated OER
What Percentage of Time Do You Spend Doing Daily Activities?
Engage your kids with an intriguing, real-life exploration that covers several areas in math, and allows for natural academic differentiation.
Curated OER
Hydrogen Peroxide Analysis
A scenario is presented for chemistry techs to address. Using titration techniques, they must analyze hydrogen peroxide solution samples. They evaluate accuracy and precision in the process. They also gain experience consulting the MSDS...
Curated OER
How Big Is That Star?
Aspiring astronomers study stars. They compare stars and explain the relationship between radius, mass, and diameter. By creating a star simulation, they discover how a binary star system's orbit can cause changes in the observed...
Scholastic
Study Jams! Find Probability
Sam bought tickets for a school raffle and wants to know if he has a good chance of winning. Help him find out with this step-by-step presentation on basic probability. Examples clearly model how to find the probability of simple events...
Illustrative Mathematics
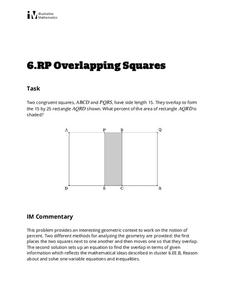
Overlapping Squares
The objective of this activity is to find the percent of the area of a two squares overlapping. Mathematicians find the ratio of area for the part that overlaps to the rectangle formed. The final answer is a percent as a rate per 100....
Illustrative Mathematics
Dana's House
Your class is to find the percent of the lot that is not covered by a house. Make sure your pupils understand the problems before they begin. The lot is the whole of the percent problem and the house is the part. The exercise is good...
Illustrative Mathematics
Gotham City Taxis
Taxi! Have your travelers figure out how far they can go in a taxi for $10.00. They must account for the mileage rate and tip in their calculation. They can set up a table or make an equation to solve for the exact mileage they can...
Illustrative Mathematics
Sharing Prize Money
When three classrooms are to split up prize money, your mathematicians must find the percentage that each class deserves and calculate the total amount. There is an option to use a calculator and practice rounding.
Illustrative Mathematics
Sale!
Everyone loves a sale, and this worksheet allows learners to calculate which sale is more rewarding. The activity can be adapted for different thinking contexts. The answer key describes different answer choices, some being higher...
National Research Center for Career and Technical Education
Business Management and Administration: Compound Interest - A Millionaire's Best Friend
Many math concepts are covered through this resource: percentages, decimals, ratios, exponential functions, graphing, rounding, order of operations, estimation, and solving equations. Colorful worksheets and a link to a Google search for...
National Research Center for Career and Technical Education
Hospitality and Tourism 2: Costing
The lesson plan provides a richly detailed narrative and sample problems for teaching or reinforcing how to work with percentages. In particular, your audience will compute the costs per serving of food and simulate setting menu prices...
Curated OER
Linear Equations
Eighth and ninth graders solve and graph 42 different problems that include writing various equations and graphing them on a grid. First, they create a table for each equation and graph it on a grid locating the x-and y-intercepts. Then,...
Curated OER
Comparing Apples With Apples 1
Elementary schoolers observe and demonstrate how to add and subtract fractions with like denominators. They observe the teacher model a variety of fraction addition and subtraction problems and use fraction strips to complete a worksheet.
Curated OER
Probability and the U.S. Map
Learners solve and complete 20 different problems that include using a U.S. map and data table. First, they calculate the probability that they will select a state that begins with each letter of the alphabet. Then, everyone completes...
Curated OER
Investigation - The M & M Mystery
Sixth graders inspect M&M's to complete statistical data. Students interpret percent of colors represented. They convert data from decimals, fractions, and percents. Using the data, 6th graders create a bar graph and a circle graph.
Education World
The African American Population in US History
How has the African American population changed over the years? Learners use charts, statistical data, and maps to see how populations in African American communities have changed since the 1860s. Activity modifications are included to...
Curated OER
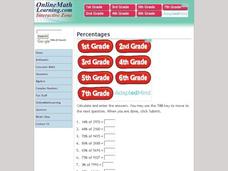
Interactive Zone: Percentages
Learners calculate the percent of a number. This one-page worksheet contains 10 problems. Answers are provided.
Curated OER
WS 8.4 Percentage Problems
In this percentage instructional activity, students calculate percentages given various types of problems. They calculate percent of compounds in a solution, they calculate mass of compounds given percentages of solutions, and they...
Curated OER
Did Voters Turn Out -- or Are They Turned Off?
What was the voter turnout at your last state election? Examine voter turnout statistics from the most recent election to learn which ten states have the best turnout record. This lesson plan offers election data, handouts, and worksheets.
Curated OER
The Art of Interpreting Percent
Ddefine the relationships between fractions, decimals, and percentages in a series of lessons. The class practices converting between these three versions of a number. They also find the common factor of a numerator and denominator and...
Curated OER
Decimals, Percents, and Fractions
Learners practice converting fractions, decimals, and percentages to communicate equal amounts. They fill in a table, determine the percentage of a total area that is shaded in diagrams, complete equations with decimals to the hundredths...
Curated OER
Fractions Forever!
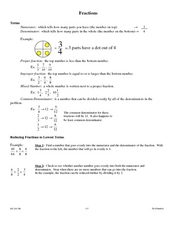
Middle schoolers identify proper, improper fractions, and mixed numbers. They reduce fractions to their lowest terms. They add and subtract fractions with different denominators, and multiply and divide fractions, as well as decimal...
Curated OER
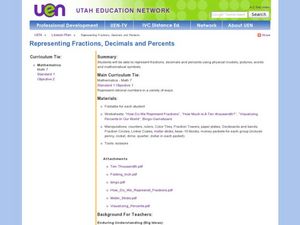
Representing Fractions, Decimals, and Percents
In this fractions, decimals, and percents lessons, students explore various methods of representing fractions. They demonstrate situations that represent rational numbers. Students create a foldable exploring fractions, decimals and...


