Curated OER
Gold Rush California and its Diverse Population
Students compare contemporary cultural differences with historical differences based on population percentage. In this cross-curriculum Gold Rush/math lesson, students analyze aspects of California's Gold Rush population and diversity...
Curated OER
Decimal Baseball
Young mathematicians represent recorded information in decimal form. In this decimals lesson, learners play a "classroom friendly" basketball game in which pupils take 10 shots. Number of shots made out of 10 is recorded as a fraction...
Curated OER
Lab: Percent of Composition of KClO3
Students find the percent of oxygen in potassium chlorate. In this percent composition lesson plan, students heat a solution of potassium chlorate using a catalyst, manganese dioxide, to decompose the potassium chlorate and release...
Curated OER
Finding Percentages
Here is an approach to calculating percent with 16 practice problems to solidify the skill. Two examples demonstrate dividing by 100 to get one percent and then multiplying by the percentage in question to get the solution. Learners find...
Curated OER
What's in a Number? Analyzing Smoking Statistics
Sixth and seventh graders analyze smoking statistics. In this health lesson, learners look at the percentage of people who smoke from each race group. They create a bar graph and circle graph that displays this information.
Education World
The African American Population in US History
How has the African American population changed over the years? Learners use charts, statistical data, and maps to see how populations in African American communities have changed since the 1860s. Activity modifications are included to...
Curated OER
Did Voters Turn Out -- or Are They Turned Off?
What was the voter turnout at your last state election? Examine voter turnout statistics from the most recent election to learn which ten states have the best turnout record. This lesson offers election data, handouts, and worksheets.
Curated OER
Fantasy Baseball
Check out this thematic unit, based on the game of baseball. Learners investigate numbers and number relations as they become familiar with some of the basic terminology associated with the game. They focus their attention on actual...
Curated OER
Coal Supply and Demand
A hands-on simulation perfect for an economics lesson, young learners investigate the availability of different sources of natural energy (coal, natural gas, oil, solar, and nuclear) and how this availability affects their cost....
Curated OER
What's Left?
Students work together to choose a favorite food that can be divided. Using construction paper, they draw a picture of the food and take turns erasing it to determine how much of it is left. They must include all equations, fractions and...
Curated OER
Explore Surface Types on a Journey Around Earth
Students explore satellite data. In this technology cross-curriculum math and world geography lesson plan, students locate specific map areas using a microset of satellite data. Students use technology and math skills to determine...
Curated OER
Working with Percentages
Students complete basic operations using percentages in a variety of real world situations. Discounts are computed and compared to a variety of prices listed in local newspaper advertisements.
Curated OER
The Stock Market
Students explore the loss and gain made in the stock market as they invest a sum of money and report the results as percentages instead of points.
Curated OER
Finding A Percentage
Helpful after a lesson on percentages, this learning exercise can reinforce the steps and formulas necessary for finding percentages. Learners calculate the percent one number is of another, and then the percent of change (increase or...
Curated OER
Decimals, Fractions and Percentages
In this arithmetic activity, 6th graders solve and complete 40 problems. First, they find the value of a number in each decimal listed. Then, students write each list of numbers in order from least to greatest. They also write the...
Curated OER
Analysis of Soda Taste Test Data
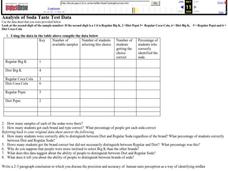
In this analysis worksheet, students are given the raw date from a soda taste test experiment. Students use that data to complete a graphic organizer and to answer 8 questions.
Curated OER
Matrices
In this matrices instructional activity, 9th graders solve and complete 11 different problems that include interpreting various matrices shown. First, they determine the operations that would result in the matrix illustrated. Then,...
Curated OER
Data Management and Probability: Applications
In this data management and probability applications activity, 7th graders solve 13 different types of problems that include finding the mean, median, mode, and range of each set of values, as well as, solving a number of word problems....
Curated OER
Ratios, Rates and Percentages
In this ratios, rates and percentages instructional activity, 6th graders solve 16 different types of problems that include writing each ratio as a decimal and a fraction in lowest terms as a percent. They also arrange numbers in...
Curated OER
Finding the Percent of a Number
For this mathematics worksheet, 6th graders find the percents of various numbers. They set up the problem, estimate, and write their response. Students also compare their answers to their estimates for each problem.
Math Mammoth
Decimal Place Value
In this mathematics worksheet, 5th graders write each of the written form into a number form. Then they name the place value that has been underlined in the number. Students also write each decimal number into its normal form.
Curated OER
Hot shots 1
Students recognize the simple percentages equivalent to ?? or ?? etc, and their equivalent value as decimals. They work independently of the teacher to practice number properties. Answer key included.
Curated OER
The Meaning Of Percent
This lesson provides students with a variety of exercises which allow them to increase their ability to understand percentage.
Curated OER
It's a Sale!
Students make good decisions about making purchases of items on sale and explain how percentages effect cost.


