Curated OER
Four Decimal, Fraction, and Percent Activities
In this fraction worksheet, students solve problems presented in four different activities. The activities cover percentages, fractions, decimals, currency exchange, and value added tax. A card "game" is one of the...
Raytheon
Percentages
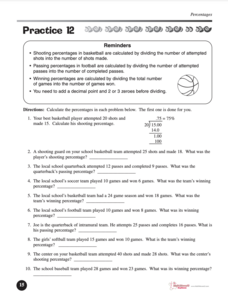
In this percentages worksheet, students complete percentage word problems dealing with money, division, fractions, and more. Students complete 54 problems.
Curated OER
Missouri Rice Farming
Sixth graders investigate rice farming in Missouri. In this percentages lesson, 6th graders determine how much rice production has increased over time. Students find this number in percentages. Students then figure the percent of acres...
Curated OER
High or Low- Probability
Students use playing cards to examine probability. In this probability lesson, students work in groups with a deck of cards and predict if the next card they lay down will be high or low. Students fill out a graphic organizer with their...
Curated OER
Apple Estimation: Percentages & Subjective Reasoning
Young scholars practice using their estimation skills by utilizing apples. In this percentage lesson, students utilize a scale and an apple to discover the percentage of each bite they take. Young scholars share their data...
Curated OER
Fractions as Percentage and Decimals
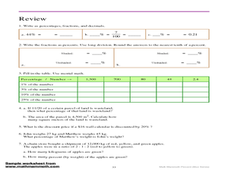
In this fractions, percentages, and decimals worksheet, students solve 14 problems where they must convert back and forth. Students are given numbers in fraction, percentage, and decimal form and are asked to change their form.
Curated OER
Number: Percentages
Learners practice and then have a race to calculate percentage and fractional parts. In this percent and fraction lesson, students start with 1% and work their way up. After each practice a quick race takes place. ...
Curated OER
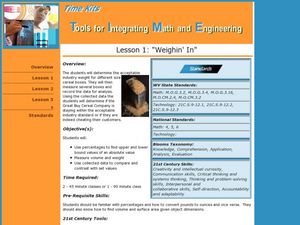
Tools for Integrating Math and Engineering: Weighin' In
Students collect and analyze data on a fictional cereal company's products. In this measurement lesson, students collect data from cereal boxes (weight, volume, surface area, etc.) to determine if the boxes labels correctly inform...
Curated OER
How Much Ocean?
In this ocean worksheet, students are given a map of the world and they predict the amount of water that covers the Earth's surface. They count the total number of squares on the given map that represent the water and they land and they...
Curated OER
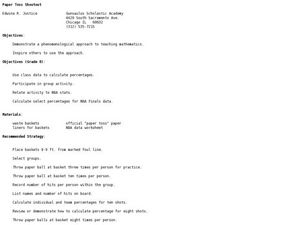
Paper Toss Shootout
Students explore the concept of percentages. In this math lesson, students throw paper at wastebaskets as if shooting a basketball in a hoop. Students shoot the paper a given amount of times and then calculate their shooting percentage....
Curated OER
Time Management: Piece of Pie
Students examine their own lives and how well they manage their time outside of school. In this this time management lesson, students discover the amount of time they spend on other activities, and create a pie chart with that...
Curated OER
A Trillion Here...A Trillion There
In this working with large numbers worksheet, learners are given the finance statistics for the US and the world for the 2006-2007 year. Students solve 11 problems including finding averages and percentages for the given statistics and...
Curated OER
Fractions and Percentages
In this fractions and percentages activity, students are given 4 mental test each with 8 problems including finding percentages, converting decimals and fractions to percentages, and adding, subtracting and multiplying fractions.
Curated OER
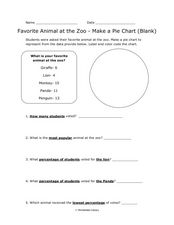
Pie Chart: Favorite Animal at the Zoo
In these three interpreting a pie chart and answering questions worksheets, students use the data provided to label and color code the blank and outlined pie charts, read and interpret a completed pie chart, and then answer questions...
Curated OER
Percentages
In this percentages worksheet, 6th graders solve and complete 13 various types of problems. First, they convert the percentages to fractions and simplify. Then, students convert the percentages to decimals. In addition, they find the...
Curated OER
Solar Storms-Fractions and Percentages
In this solar storms worksheet, students find the percentage of X-Flares and Halo CMEs that occurred in solar storms and complete a Venn Diagram comparing the numbers of each.
Curated OER
Percentages
In this percentages learning exercise, students read about how to express numbers as fractions, convert to decimal form and find the percent. They practice by solving four problems using the method they read about.
Curated OER
Working with Percentages and Proportions
In this percentages and proportions worksheet, students are given percentages, they express them as a proportions, they create an equivalent ratio using "x" for the unknown portion and they cross multiply and divide to find their answer.
Curated OER
Global Distribution of Water
In this water instructional activity, students are given the percent of distribution of water on earth. With the total amount of water equal to 1,000ml students determine the number of ml for each type of water on earth and color a...
Curated OER
Problem-Solving Application: Make a Circle Graph
In this circle graphs worksheet, learners analyze a data table about the activities in a day. Students then use this data to make a circle graph. Learners answer 6 questions about the graph.
Curated OER
Thinking About Technology: What Is It? How Can It Help Us?
What is technology and how can it help us? Using a worksheet, students read a list and choose practical applications of scientific knowledge, brainstorm examples of home, school and hospital technology, graph answers in a pie chart, and...
Curated OER
Percentages Introduction
In this percentages worksheet, students color 25% of 100 small squares blue, 35% red and 30% yellow. Students figure out how many squares they have left and then what percent of the 100 squares are left. Students then work out 5...
Curated OER
Math--Fractions and Percentages
In this fractions and percentages worksheet, students write down the percentages of a pie chart and change then into fractions. Students change 7 fraction sentences into a percentage sentence.
Curated OER
Pies and Percentages--Learning About Pie Graphs
In this pie graph worksheet, students draw a pie graph for the zookeeper with the data he collected, choose a different color for each animal species and make a key to the graph.


