Curated OER
The Voting Game
Upper graders play the voting game to help them understand voting patterns, political movements, and build a content specific vocabulary. Each student creats a chart to determine if his or her political view veers liberal or...
Curated OER
Using Bar Graphs to Understand Voting Patterns
Bar graphs are used as a way to study voting patterns in the United States. A variety of statistical data is presented in the graphs, and pupils must interpret the data in order to make a report to the class. Three excellent graphs,...
Curated OER
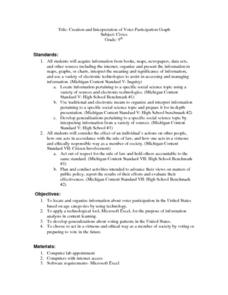
Creation and Interpretation of Voter Participation Graph
Ninth graders research information about voter participation in the United States based on age. They develop generalizations about voting patterns in the U.S and use Microsoft Excel to analyze the information.
Curated OER
A Closer Look at Voting Patterns
Students examine the importance of voting. They analyze voter turnout graphs, conduct research, list the benefits and costs of voting, and write a paper that describes ways to increase voter participation.
University of Richmond
Digital Scholarship Lab: Voting America: White Population Density, 1840 2000
This map shows population change among whites in US counties, 1840 to 2000. Each dot represents 500 people. Corresponding historical events and elections are included for each period of time.
University of Richmond
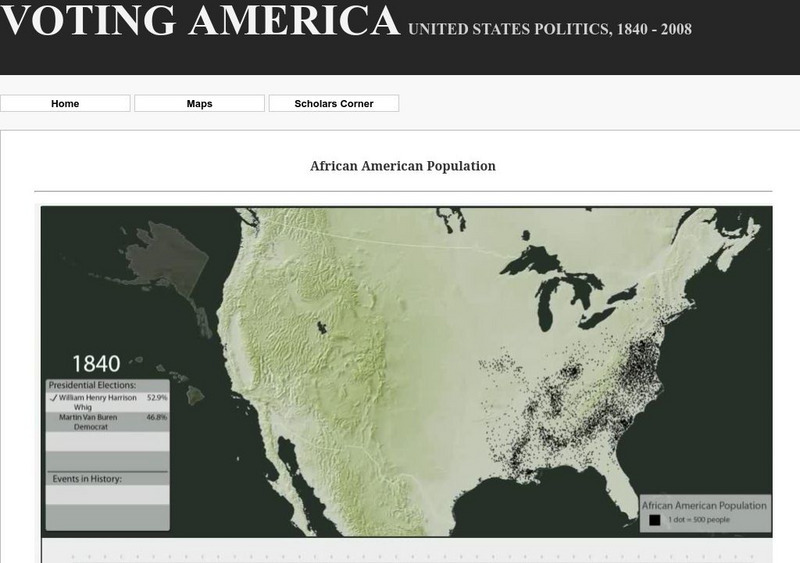
Digital Scholarship Lab: African American Population Density, 1840 2000
This interactive map shows the African-American population change in U.S. counties from 1840 to 2000. Each dot represents 500 people. Corresponding historical events are included for each period of time.


