Curated OER
Water Web
In this water web worksheet, students explore, analyze and discuss how weather stations interact with maintaining weather conditions and answer two essay questions and ten multiple choice questions.
Curated OER
Water Drops
In this environment worksheet, students participate in a variety of activities. For example, students write five clues about something they might find in a natural setting.
US Geological Survey
Usgs: Water Science for Schools Activities Center
This website offers three activity centers: Questionnaires, Opinion Surveys, and Challenge Questions. Take a look at these interesting water research activities from the US Geological Survey. Click Home to access the site in Spanish.
My Science Site
Water Vulnerable to Climate Change [Pdf]
A very extensive unit on climate changes and how they are caused as well as how they can be prevented. Incorporates science, geography, language arts, current events, environmental and social studies. Tests and games included. PDF...
Scholastic
Scholastic: Study Jams! Science: Ecosystems: Water Cycle
Watch an animated video on the water cycle, become familiar with related vocabulary terms, and then quiz yourself on the parts of the water cycle, and review your answers when you're done. Site includes guidelines for a lesson entitled...
Other
Eastern Ontario Children's Water Festival: Water Discovery Centres
The activities listed here are those used at water festivals around Eastern Ontario and many could be duplicated in the classroom.
Science and Mathematics Initiative for Learning Enhancement (SMILE)
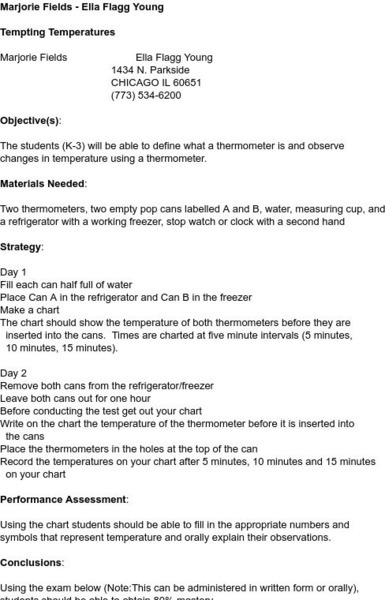
Smile: Tempting Temperatures
In this lesson plan students learn how to use a thermometer and compare changes in temperature using water in the fridge and water in the freezer. Helps students create charts to analyze data.


