Texas Instruments
Texas Instruments: How Strong Is Your Bridge?
Build a bridge of straw and straight pins. Data is collected and analyzed with handhelds by the students measuring the height of the bridge vs the number of marbles (in a cup.)
Texas Instruments
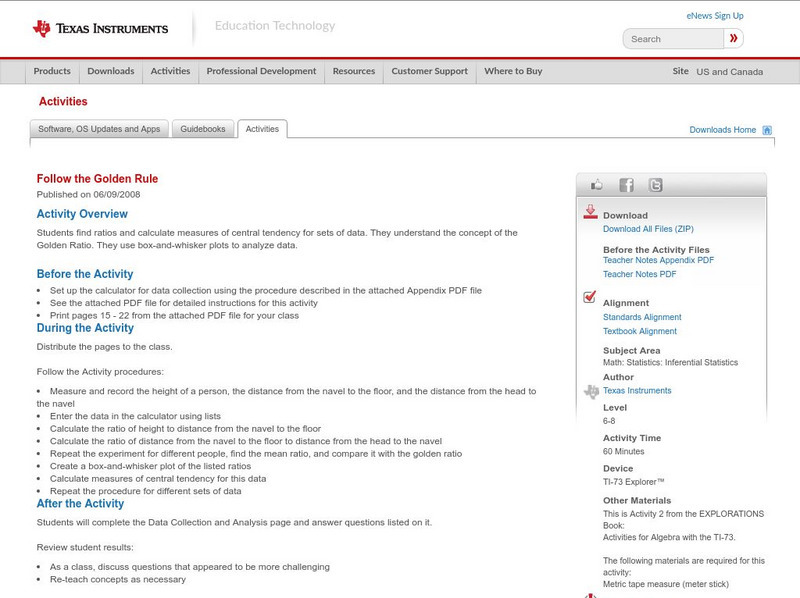
Texas Instruments: Follow the Golden Rule
Students find ratios and calculate measures of central tendency for sets of data. They understand the concept of the Golden Ratio. They use box-and-whisker plots to analyze data.
Texas Instruments
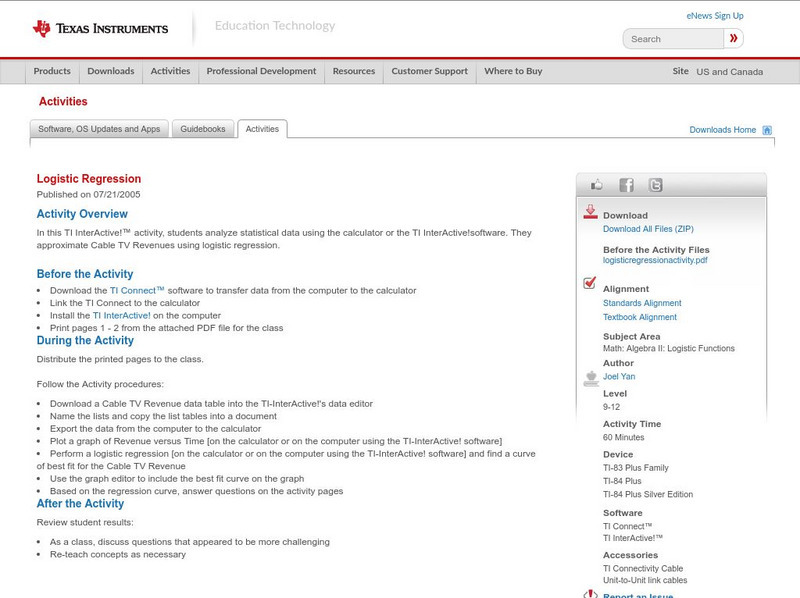
Texas Instruments: Logistic Regression
In this TI InterActive! activity, students analyze statistical data using the calculator or the TI InterActive!software. They approximate Cable TV Revenues using logistic regression.
Texas Instruments
Texas Instruments: Data and Statistical Methods 2
In this set of exercises, a set of data is provided; students can use appropriate statistical methods to analyze the data. Questions are multiple choice and true/false with solutions provided.
Texas Instruments
Texas Instruments: Do You Have a Temperature?
In this activity, students represent and analyze climate data. They use linear regressions to understand the relationship between temperatures measured in the Fahrenheit and Celsius scales and examine conversion factors.
Texas Instruments
Texas Instruments: Curve Ball
In this activity, students collect data for a bouncing ball using a motion detector. They analyze the data and attempt to find a model for the height of the ball as a function of time.
Texas Instruments
Texas Instruments: Data Analysis
Students learn to design data investigations, describe data, and draw conclusions. They learn to choose the best type of graph, graph and interpret the data, and look for patterns and trends. They also use the calculator to investigate...
Texas Instruments
Texas Instruments: Canadian Life Expectancy
In this activity, students analyze statistical data Using the calculator and the TI-InterActive! software. They perform regression on the data to find the life expectancy of people in Canada.
Texas Instruments
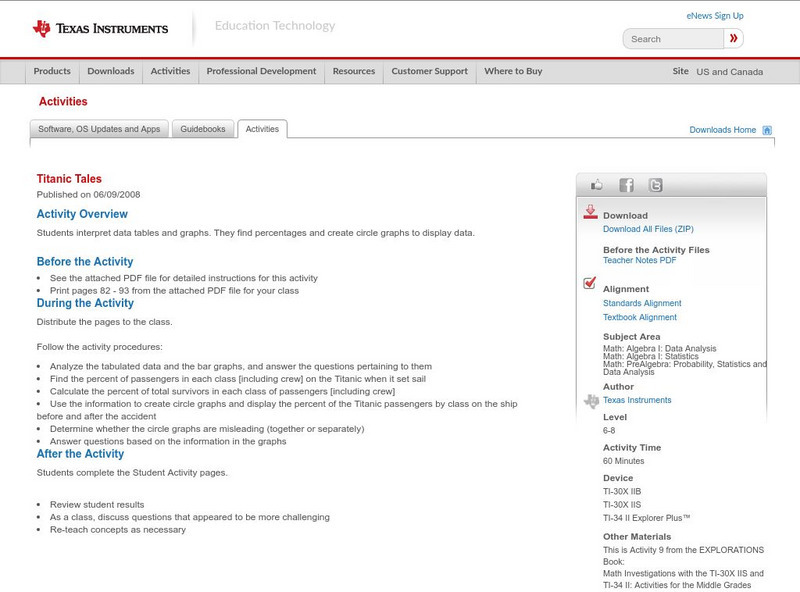
Texas Instruments: Titanic Tales
In this activity, students interpret data tables and graphs. They find percentages, and create circle graphs to display data.
Texas Instruments
Texas Instruments: Statistics for Math B
Students will determine the mean, median, mode and standard deviation of collected data. They will make a frequency histogram of the grouped data, both on graph paper, and on the TI 83+.
Texas Instruments
Texas Instruments: Bounce Back: The Exponential Pattern of Rebound Heights
In this activity, students' will use a motion detector to collect motion data for a bouncing ball. They will then analyze the data to test the exponential model of motion.
Texas Instruments
Texas Instruments: Are Your Bones Normal?
Students can use the TI-Navigator to investigate mathematics in Forensic Science.
Texas Instruments
Texas Instruments: Ball Toss Activity
Students receive data from tossing a ball into the air. They are to graph it, set a window, and analyze the height, how long it was in the air, etc. They then find an equation that models the data.
Texas Instruments
Texas Instruments: On the Rebound
In this activity, students collect motion data for a bouncing ball using a motion detector. They analyze the data and attempt to find the exponential relationship between the bounce number and maximum height that the bounce reaches.
Texas Instruments
Texas Instruments: Greenhouse Gas Emissions
In this activity, students analyze statistical data using the calculator and the TI InterActive! software. They use linear regression to study the increase in levels of carbon dioxide emission over the years.
Texas Instruments
Texas Instruments: Solving a System of Linear Equations
In this activity, students' will collect and analyze motion data in order to determine the solution to a linear system of equations. They graph two motions on a common axis and find their intersection.
Texas Instruments
Texas Instruments: Making Conjectures and Planning Studies
This activity introduces students to the concept of collecting and analyzing data and using conjectures to formulate new questions.
Texas Instruments
Texas Instruments: Measure Up
In this activity, students compare their height with the average height of students in the class. They create histograms to analyze the data, and construct box plots to summarize the height statistics.
Texas Instruments
Texas Instruments: Help, a Pipe Is Leaking!!!
In this activity, students will simulate a pipe leaking and collect data. Students will then use the TI-73 calculator to determine how many gallons would leak at that rate for a 30-day month.
Texas Instruments
Texas Instruments: How Do You Measure Up?
In this activity, students graph scatter plots to investigate possible relationships between two quantitative variables. They collect data and analyze several sets of data pairing the two quantities.
Texas Instruments
Texas Instruments: Learning Measurement Conversions Through Statistics
Students learn the conversion relationship between inches and centimeters through data collection. The data collected results from measuring items using inches and centimeters as the units. They use a TI-73 to input the data into lists...
Texas Instruments
Texas Instruments: Exploring the Golden Arches
Using given nutritional information of popular items from McDonald's, the students will develop and test a conjecture based on the given information. The students will analyze the two-variable data using the graphics calculator by...
Science Education Resource Center at Carleton College
Serc: Mn Step: Statistical Analysis of Lincoln
For this activity, students first work in groups to collect information about a set of pennies. They measure and record the mass for each one in a table using a spreadsheet program if possible. They also record its year and, for 1982...
Beacon Learning Center
Beacon Learning Center: All That Data 2
Students describe graphs and explore range, measures of central tendency, and distribution in this interactive web lesson.


