Beacon Learning Center
Beacon Learning Center: All That Data
Students analyze data by finding the mean, median, mode, and range of a set of numbers. Line plots, bar graphs, and circle graphs are also included in this lesson.
Other
Global Grocery List Project: Homepage
At this site from the Global Grocery List Project, students collect data on the prices of common grocery items and submit their findings. They can then compare the data they collected to data from students around the world. There are...
PBS
Pbs Teachers: Scientific American: Deep Crisis: Salmon Counting
In this lesson, students can explore the techniques of census and population counting by inferring numbers of a virtual population illustrated within a rectangular sampling grid, and observing the accuracy of the technique in relation to...
Microsoft
Microsoft Education Lesson Plan: Candy Is Dandy
Explore color distribution of M&M candies using this detailed lesson plan. An engaging integrated lesson that requires understanding of spreadsheets and formulas, and logical reasoning. Links to related websites.
McGraw Hill
Glencoe: Self Check Quizzes 2 Misleading Statistics
Use Glencoe's Math Course 2 randomly generated self-checking quiz to test your knowledge of spotting misleading statistics. Each question has a "Hint" link to help. Choose the correct answer for each problem. At the bottom of the page...
Khan Academy
Khan Academy: Interpreting Quartiles
Practice understanding the meaning of quartiles of data sets. Students receive immediate feedback and have the opportunity to try questions repeatedly, watch a video or receive hints.
Khan Academy
Khan Academy: Reading Histograms
In this exercise, students practice reading histograms. Students receive immediate feedback and have the opportunity to get hints and try questions repeatedly.
Math Is Fun
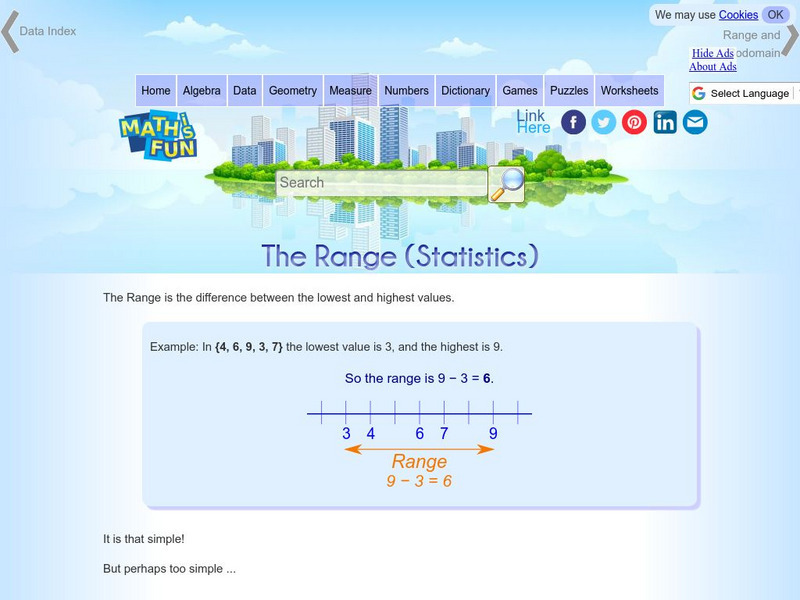
Math Is Fun: The Range (Statistics)
Explains the definition of 'range' and what it means in different mathematical contexts. Includes examples and ten practice questions.
ClassFlow
Class Flow: Data Analysis Using Graphing
[Free Registration/Login Required] This flipchart allows students to analyze data using appropriate graphs, including pictographs, histograms, bar graphs, line graphs, circle graphs, and line plots introduced earlier, and using...
Khan Academy
Khan Academy: Calculating the Median: Data Displays
Practice computing the median of data sets presented in a variety of formats, such as frequency tables and dot plots. Students receive immediate feedback and have the opportunity to try questions repeatedly, watch a video or receive hints.
Sophia Learning
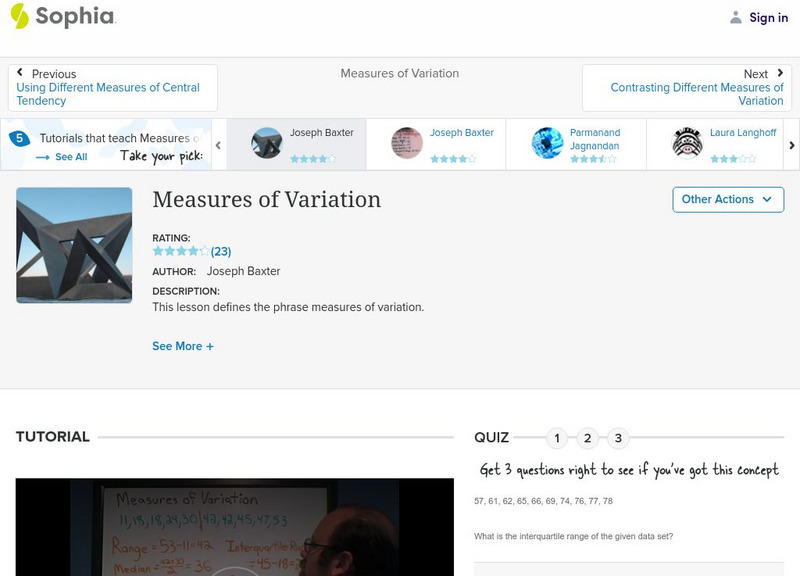
Sophia: Measure of Variation
Explore the measures of variation and check understanding with an assessment.
BBC
Bbc: Bitesize Revision: Data Handling: Mean
Need the basics on how to find a mean? Interactive examples are available that help you find the mean using data from a frequency table. You can also enter your own data and find the mean. You will find plenty of guided practice and...
BBC
Bbc Skillswise: Averages and Range
BBC Skillswise provides multiple factsheets, quizzes, activities, and worksheets on averages and variations.
National Council of Teachers of Mathematics
Nctm: Figure This: Does Drinking Soda Affect Your Health?
Try this "Real world," challenge taken directly from the today's health journals. Use your problem solving, data analysis, and number sense skills to figure out if soda intake among teenage girls is related to incidences of broken bones....
National Council of Teachers of Mathematics
Nctm: Figure This: Census
Try this real world challenge that focuses on data collection, data analysis, and problem solving with information from the U.S. Census Bureau. Discover how these skills are applied in real life situations in this one page activity from...
Khan Academy
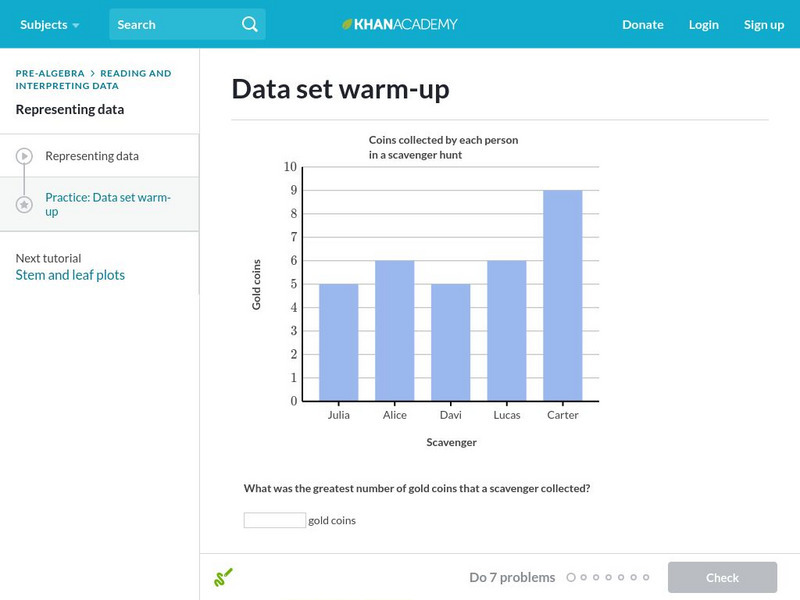
Khan Academy: Data Set Warm Up
Begin your journey into the world of statistics with some warm-up questions about data sets. Students receive immediate feedback and have the opportunity to try questions repeatedly, watch a video or receive hints.
Khan Academy
Khan Academy: Reading Dot Plots & Frequency Tables
Practice reading basic dot plots and frequency tables. Students receive immediate feedback and have the opportunity to try questions repeatedly, watch a video or receive hints.
National Council of Teachers of Mathematics
The Math Forum: Growth Creature Lab Data Collecting
Lesson plan completely explains how students will collect data on the growth of an "alligator" and determine the relationship of the growth data to the Fundamental Theorem of Similarity and to topics in geometry in general. All of the...
National Council of Teachers of Mathematics
Nctm: Figure This: Do Women Live Longer Than Men?
Use this site to figure out if women really do live longer than men. A math challenge taken from today's health journals that explores data collection, data analysis, patterns, and graphing skills. Learn how mastering these skills can be...
Council for Economic Education
Econ Ed Link: Mystery Workers: Productive Resources
This website focuses on productive resources which are divided into three categories, natural, human, and capital.
Other
Stat Trek: Data Patterns in Statistics
This lesson looks at how to recognize patterns in a data display by examining the shape of a graph, the center, the spread, and unusual features such as outliers. Includes video. [11:16]
Texas Instruments
Texas Instruments: Let's Play Ball With Box and Whisker Plots
This activity is designed to help students make decisions about what and how information could be displayed graphically. The data set deals with salaries of professional baseball players. It is designed for students to determine if the...
Illustrative Mathematics
Illustrative Mathematics: S Ic, S Id Musical Preferences
Students will use a data set to demonstrate that they know what it means for two variables to be associated. Explanations and solutions are provided.
Texas Education Agency
Texas Gateway: Informational Text: Analyze Graphical Sources: Practice 2
[Accessible by TX Educators. Free Registration/Login Required] In this lesson, you will learn how to evaluate the clarity and visual appeal of images and other graphic elements included in a reading text. Practice exercises are included.


