Texas Education Agency
Texas Gateway: Analysis of Relative Values of Specific Data, Facts, and Ideas
[Accessible by TX Educators. Free Registration/Login Required] In this lesson, you're going to begin to think about how to analyze the data, facts, and ideas that you need to support your argument, the final step in planning your...
PBS
Pbs Learning Media: The Voyage of Zheng He I
This video segment adapted from 1421: The Year the Chinese Discovered America? introduces the theory that the Chinese discovered America prior to Columbus.
ABCya
Ab Cya: It's Glow Time Mean, Median, Mode, & Range
Want to have fun while learning Mean, Median, Mode, and Range? Well... It's Glow Time! In this game kids can play a favorite arcade game to earn tickets and points, and then analyze the data. Type in the correct answers to enter Free...
National Council of Teachers of Mathematics
Nctm: Illuminations: Canada Data Map
Information can be represented in many ways, and this application allows the user to represent data about the provinces and territories using colors.
Better Lesson
Better Lesson: Understanding Data!
Fourth graders will gear up to explore how to find the means, median, and modes to represent data.
National Council of Teachers of Mathematics
Nctm: Illuminations: Histogram Tool
This tool can be used to create a histogram for analyzing the distribution of a data set using data that you enter or using pre-loaded data that you select.
PBS
Pbs Learning Media: Central Tendency: Targeted Math Instruction
At the end of this lesson, students will be able to recognize and apply the concepts of mean, median, and mode in real-life problems.
Math Slice
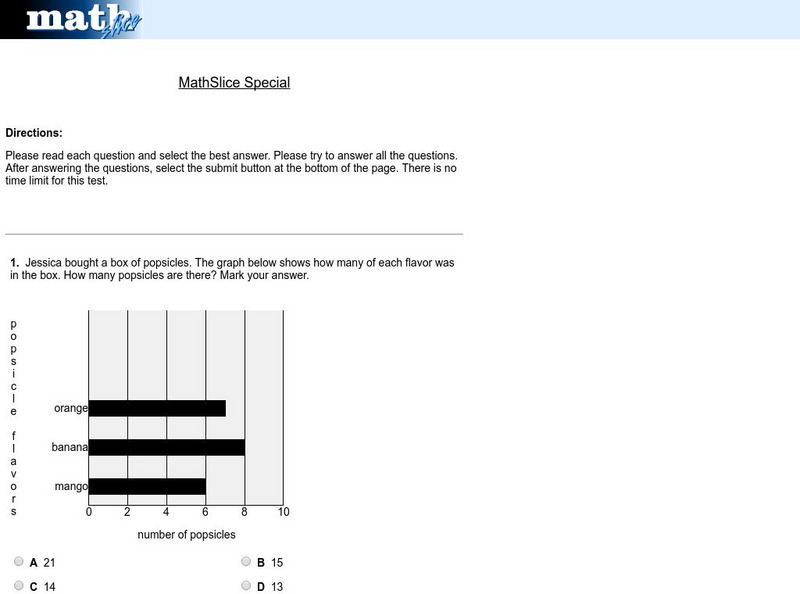
Math Slice: Chart Slice Special Test
A ten question test assessing data collection and analysis skills with bar graphs. Assessment is scored online. An excellent tool for assessment.
US Department of Education
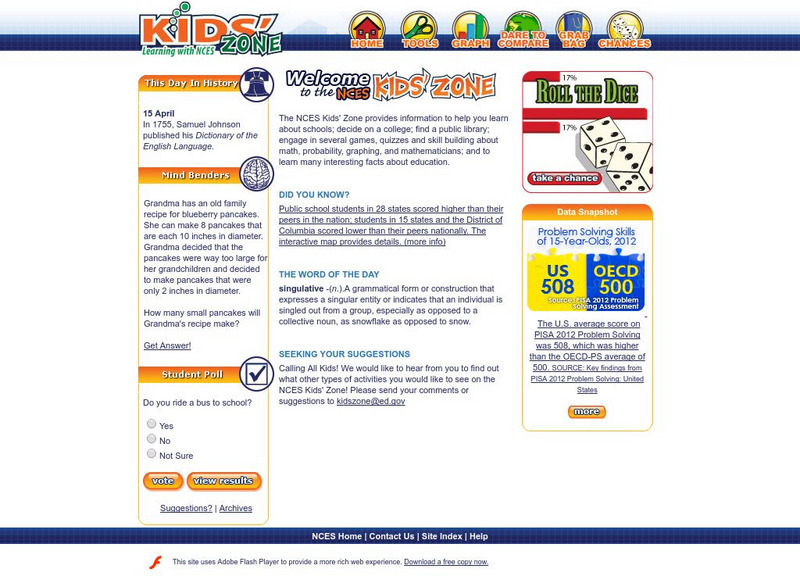
National Center for Education Statistics: Nces Classroom
Just what is the NCES Students' Classroom? In addition to many useful features, this site provides math and statistical activities tailored to a middle and elementary school students.
National Council of Teachers of Mathematics
Nctm: Figure This: Who's on First Today?
Batter up! Who has the higher batting average, Joe McEwing or Mike Lieberthal? Try your computation and averaging skills in this real-world math challenge. Learn how sharpening your averaging skills can be valuable in real life...
EL Education
El Education: Is Lake Merritt Worth 198 Million Dollars?
6th grade students from Oakland, California, created this report to show their answer to the question: "What do the dissolved oxygen levels tell us about the water quality of Lake Merritt?" Students explored this question to collect...
ClassFlow
Class Flow: Statistics Landmarks Vote
[Free Registration/Login Required] This lesson uses clustering to explore the concept of mean, median, and mode of a set of data and calculates the arithmetic mean.
ClassFlow
Class Flow: Averages Handling Data
[Free Registration/Login Required] This is a dynamic flipchart displaying and using measures of central tendency- mean, medium, mode, and average. Pictures capture the eye, for sure.
ClassFlow
Class Flow: Charts Handling Data
[Free Registration/Login Required] Reading graphs fit together with this engaging, colorful flipchart analyzing pie charts, bar graph, percents, and fractions.
ClassFlow
Class Flow: Magic Squares
[Free Registration/Login Required] Students solve arithmetic problems in sequences to create magic squares.
Houghton Mifflin Harcourt
Holt, Rinehart and Winston: Homework Help Independent Practice: Interpreting Graphs and Tables
Get independent practice interpreting graphs and tables. Each incorrect response gets a text box explanation and another try. Correct responses are confirmed.
National Council of Teachers of Mathematics
Nctm: Figure This: How Many Fish in the Pond?
Can you figure out how many fish are in a pond? Use the statistical method of capture-recapture and estimation to solve this math challenge. An investigation from the NCTM Math Challenges for Families series. Discover how this skill can...
National Council of Teachers of Mathematics
Nctm: Figure This: Animal Ages
An investigation for the animal lovers that focuses on measurement conversion, data analysis, and calculating growth rates.
National Council of Teachers of Mathematics
Nctm: Figure This: How Many Colors of States Are on a Us Map
Try this data collection and analysis math challenge on map coloring. An interesting approach to analyzing complex data. This one page activity is part of the NCTM Math Challenges for Families collection.
Books in the Classroom
Carol Hurst's Children's Literature Site: Data Gathering and Analyzing
Carol Hurst provides this sample chapter from "Picturing Math." Gathering data is a frequent part of solving problems and satisfying curiosity, which includes working with graphs and using mathematical tools such as averaging and other...
Rice University
Rice University: The Hand Squeeze
Students will enjoy this data collection and class analysis experiment involving the time it takes for a hand squeeze to travel around a circle of people. From organizing the activity to collecting the data to making a table and graphing...
Ducksters
Ducksters: Kids Math: Mean, Median, Mode, and Range
Define these terms with this website: mean, median, mode, and range. Learn how they work, terms, tricks, and examples.
Calculator Soup
Calculator Soup: Mean Calculator | Average Calculator
In statistics the mean of a set of numbers is the average value of those numbers. Find the average or mean by adding up all the numbers and dividing by how many numbers are in the set.


