Curated OER
Worksheet 31 - Doman & Range
In this function worksheet, students determine the domain and range of given functions. They use trigonometric ratios to determine if a statement is true or false. Students differentiate equations. In this one-page worksheet, students...
Curated OER
Using Averages
In this math worksheet, students compute the range, mean, median and modal weight of candy bars from two machines. Students write a short essay about which machine is using too much chocolate and which is more reliable.
Curated OER
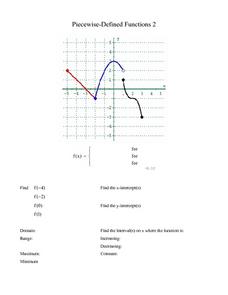
Piecewise-Defined Functions 2
In this Piecewise-Defined function worksheet, 10th graders identify the function for a given graph. Additionally, they find the y-intercept, y-intercept, domain, range and interval of each function. Students solve this information for...
Curated OER
Piecewise-Defined Functions 1
In this piecewise-defined function, students explore the graph of given functions and match it to the proper equation. They identify the x and y-intercepts, domain, range, and interval of each function. There are approximately ten...
Curated OER
Domain and Range
In this domain and range worksheet, students write the definitions for relation, function, domain and range. They then find the domain and range of 7 sets of ordered pairs. Finally, students answer 4 questions regarding inverse relations...
Curated OER
Graphs and Transformations of Functions
Is it possible to solve quadratic equations by factoring? It is, and your class will graph quadratic equation and functions too. They perform transformation on their graphs showing increasing and decreasing intervals, domain, and range....
Curated OER
What's Your Average? What Do You Mean? I'm More Than Just Average
Upper grade and middle schoolers collect data, analyze and interpret the data. This three-part lesson should provide learners with a firm understanding about the differences between mean, median, and mode and how to perform the...
Curated OER
Quiz: Mean, Median, Mode, and Range
Use this measure of central tendency worksheet to have learners find mean, median, mode and range of ten sets of nine numbers. Numbers are presented in a series of lists.
Curated OER
Line Plots - Homework 6.3
Elementary schoolers use data in a table to make a line plot, then answer five related questions. Houghton Mifflin text is referenced.
Curated OER
Mean, Median, Mode, and Range - Homework 14.3
In this data and statistics worksheet, learners find the mean, median, mode, and range of 4 different sets of data. Next, students solve 1 word problem where they find the mean.
Curated OER
Survey: What Shape Has More In the Lucky Charms Box?
In this Lucky Charms worksheet, students identify the shapes in the box, and using tally marks, count how many of each shape are included. This worksheet may be used in elementary grades, for counting and tally purposes, but it also can...
Curated OER
How Alike Are We?
Fourth graders find the range, mode, median, and mean for each of the data sets (height and shoe size). They discuss which measure of central tendency for each data set best represents the class and why. Students graph the shoe size and...
Curated OER
Definition of a Function
Get those kids to solve and graph 10 different problems that include various types of functions and their relations. They determine if each graph represented is the relation of a function then determine which value of the variable will...
Curated OER
Pedal Power
Employ proportional reasoning and algebraic understanding to a determine a real world math quandary. Intel has created a project based unit to engage learners in using algebra to describe the physical world. They will create equations,...
Curated OER
Linear Piecewise Functions
Students explore the concept of piecewise functions. In this piecewise functions lesson, students graph piecewise functions by hand and find the domain and range. Students make tables of values given a piecewise function. Students write...
Curated OER
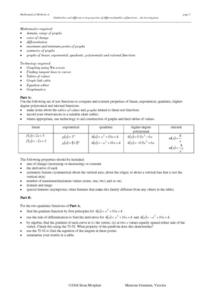
Similarities and Differences in Properties of Different Families of Functions - An Investigation
Exploring families of functions allows high schoolers compare and contrast properties of functions. Students discuss properties that include symmetry, max and min points, asymptotes, derivatives, etc.
Curated OER
Exponential Graph Functions
In this exponential functions worksheet, students solve and complete 13 various types of problems. First, they define what is different and what is the same about exponential and linear functions. Then, students write a rule for each...
Curated OER
Exponential Functions
For this exponential functions worksheet, students solve and complete 20 various types of problems. First, they graph the function and state the domain and range. Then, students tell whether the graph represents exponential growth or...
Curated OER
Twenty-One Domain and Range Problems
In this domain and range worksheet, students identify the domain and/or range for twenty-one free-response and multiple choice problems. The functions include trigonometric functions. The solutions are provided.
Curated OER
All in the Family
Students use data to make a tally chart and a line plot. They find the maximum, minimum, range, median, and mode of the data. Following the video portion of the lesson, students will visit a Web site to test their data collection skills...
Curated OER
How Big Is Your Head?
Students explore measurement by measuring classmates' heads. They record their measurements and they put the measurements in order from smallest to largest. Students figure the mean, median, mode, maximum, minimum, and range of their...
Curated OER
Easy Worksheet: Domain and Range
In this domain and range worksheet, students solve 4 short answer problems. Students find the domain and range of various functions given an equation, table of values, or graph.
Curated OER
Graphing Rational Functions
For this Algebra II worksheet, 11th graders graph rational functions and use the graph to solve real-life problems. The four page worksheet contains forty-one problems. Answers are not provided.
Curated OER
Global Statistics
Students determine statistics based on data. In this statistics lesson, students use data and record in charts. Students create graphs based on the statistics found.


