Curated OER
Global Statistics
Students select appropriate data to determine the mean, median, mode and range of a set of data. They calculate the statistical data on literacy rates and life expectancy within each geographic region of the world. Students determine...
Curated OER
In the Right Mode
Sixth graders practice determining mean, median, mode, and range using individual mileage logs. They convert miles to kilometers and graph their results.
Curated OER
Using Mean, Median, Mode, and Range through Basketball
Eighth graders use the sports pages of the newspaper to analyze the mean, median, mode and range of basketball statistics.
Curated OER
Under the Weather
Students review mean, median, mode, and range while using the newspaper to answer weather questions.
Curated OER
There Is No Place Like Home on the Range
Fourth graders use data from the real estate guide to find the range, mode, median, and mean of a sampling of homes for sale in their area.
Curated OER
Technology vs. Nontechnology
Fourth graders determine the range, mean, median and mode using a computer spreadsheet. An identical set of calculations is done without using a computer. The results of each method are compared. They calculate the mode, median and range...
Curated OER
Sound; Year 1
Students, on a listening walk around the school and its grounds, make notes/comments on the range and variety of sounds in each environment. They listen to recorded sounds and attempt to recognize them.
Curated OER
Box Plots
Students review the concept of median, explore how to calculate quartiles for any size data set and experience how to build a box plot.
Curated OER
Making a Brand for Ourselves the "Cowboy" Way
Fourth graders research the history of Utah. Students explore westward expansion and the importance of ranching in Utah's history. Students also investigate cattle drives in Utah.
Curated OER
Graphing Data
Second graders examine how to make and read bar graphs. For this bar graph lesson, 2nd graders compare bar graphs to pictographs by looking at hair color survey data. They practice making a bar graph and finding the range of the data.
Curated OER
Range and Mode
In this range and mode activity, students read the math word problems and the numbers within the problem to help find the range and mode for each problem.
Curated OER
Measure & Evaluate Range, Mean, Median, Mode
Young scholars learn mean, median, and mode through setting up a science experiment. In this measures of central tendency lesson plan, students drop a marble into a box with 2 inches of flour and record the data. Young scholars could...
Curated OER
Mean, Median, Mode and Range Sheets
In this math worksheet, learners use the graphic organizer to display their answers when learning about measures of central tendency. There are 4 boxes: mean, median, mode and range.
Curated OER
Worksheet 2.4/2.5: MT-A141 PreCalculus
In this precalculus worksheet, students use their graphing calculator to graph the domain and range of given terms. They write parametric equations and identify the coordinates of the points on the relation given certain terms.
Curated OER
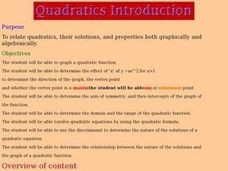
Quadratics Introduction
Young scholars investigate quadratic functions graphically and algebraically.
Curated OER
Data Days
Sixth graders practice collecting, organizing and displaying data. They create circle, bar, line and picto graphs. They analyze data in small and large sample groups.
Curated OER
Collect, organize and compare different data for the Marine Mammals of the Miami Seaquarium, i.e.: size, weight, diet and habitat and how to calculate average, median, mode and range.
Students collect, organize, and compare different data and develop statistical methods such as: average, median, mode and range as a way for decision making by constructing table
Curated OER
Home on the Range
Third graders see how to find the range of a set of numbers by analyzing data. After a lecture/demo, student pairs practice finding mode and range by solving problems put up on the board by the teacher.
Curated OER
Not Just an Average Class
Fourth graders work together to find the median, mode, and mean of their first and last names using a numerical code in this fun, interactive lesson plan. After a lecture/demo, 4th graders utilize a worksheet imbedded in this plan to...
Curated OER
Range and Measures of Central Tendency
Third graders take notes on a PowerPoint presentation featuring calculating and analyzing data. They practice skills highlighted in the presentation and create a table in Microsoft Excel showing data analysis.
Curated OER
Mind Your Business
Students explore how to identify the range, median, and mode in a list of numbers by using concrete materials.
Curated OER
Probability: the Study of Chance
Students experiment to determine if a game is fair, collect data, interpret data, display data, and state and apply the rule for probability. Students use a simple game for this experiment.
Curated OER
Calculating Range for a Constant Velocity
Students read an explanation from the NASA Web-based "textbook", The Beginner's Guide to Aerodynamics, then use the information in combination with data from other Web sites to solve single variable equations for distance (range), time,...


