Illustrative Mathematics
Chicken and Steak, Variation 2
Many organizations put on barbecues in order to make money. In a real-world math problem, the money allotted to purchase steak and chicken at this barbecue is only one hundred dollars. It is up to your potential chefs to figure out how...
Illustrative Mathematics
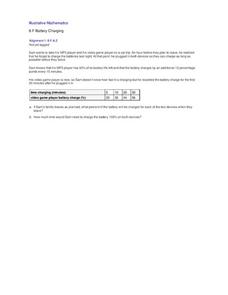
Battery Charging
Your class will be very interested in the results of this activity. How long does it take a MP3 and video game player to charge? Sam only has an hour and the MP3 player only has 40% of its battery life left. Plus, his video player is...
Curated OER
Slope, Vectors, and Wind Pressure
A hands-on lesson using the TI-CBR Motion Detector to provide information to graph and analyze. The class uses this information to calculate the slope of motion graphs and differentiate scalar and vector quantities. There is a real-world...
Curated OER
Worksheet 12: Functions
In this math worksheet, students are given 7 problems in which they differentiate, figure rate of change, determine value, and prove formulas.
Texas Instruments
Finding Linear Models Part III
Explore linear functions! In this Algebra I lesson, mathematicians graph data in a scatter plot and use a graphing calculator to find a linear regression and/or a median-median line. They use the model to make predictions.
Curated OER
Piecewise Linear Functions: Extending Stories to Graphs
Using this resource, scholars develop graphs that model situations by showing change over time. They answer 15 questions based on information from charts that show growth in weight. They extend the concepts to an assessment section of...
Curated OER
Y-Intercept and Slope Intercept Form
Alegebra amateurs identify the slope and the y-intercept given a linear equation in slope-intercept form by correctly completing some in class problems. They write the linear equation in slope-intercept form that corresponds to the given...
Curated OER
A Day at the Beach
Help learners determine the rate of change for the temperature of sand. They will collect data on the temperature of wet and dry sand over time with a heat lamp overhead. Then make a scatter plot of the data and find a linear model to...
Illustrative Mathematics
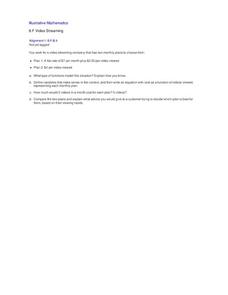
Video Streaming
Your movie fans will be interested in this resource. They will compare video streaming plans. One plan charges a set rate per month and a reduced viewing fee, and the other has a flat rate per each video viewed. Unfortunately, students...
Illustrative Mathematics
Baseball Cards
Here is a resource that demonstrates growth and the initial state of an equation. In this case, your class will be looking at baseball collections. How many baseball cards did the collector start out with, and how many were added or...
Utah Education Network (UEN)
Linear Relationships: Tables, Equations, and Graphs
Pupils explore the concept of linear relationships. They discuss real-world examples of independent and dependent relationships. In addition, they use tables, graphs, and equations to represent linear relationships. They also use ordered...
Curated OER
Introducing y = mx + b
Middle and high schoolers use the slope intercept form to graph a line. In this algebra lesson, pupils rewrite equations from standard form to y-intercept form. They use the slope and y-intercept to graph a line without making a table of...
Curated OER
Slippery Slope
Middle schoolers use a computer to complete activitites about slope. They find the slope of mountains, roofs, and stairs using rise over run. Pupils are shown different types of slopes and have to identify if the slope is positive,...
Curated OER
Linear Functions: Slope, Graphs, and Models
This math packet provides an opportunity for learners to graph two linear equations on a coordinate grid and determine the slope and y-intercept of each. They use the equation of five lines to find the slope and y-intercepts, and then...
Curated OER
A Sweet Drink
Students investigate reaction rates. In this seventh or eighth grade mathematics lesson, students collect, record, and analyze data regarding how the temperature of water affects the dissolving time of a sugar cube. Studetns determin...
Curated OER
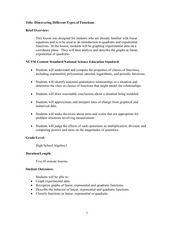
Discovering Different Types of Functions
Graph polynomials and identify the end behavior of each polynomial function. The class differentiates between linear, quadratic, and other polynomial equations.
Curated OER
Linear Functions of Two Variables
In this linear function worksheet, students write linear functions, in intercept form, that satisfy given conditions. They find the local linearity for a function. This five-page worksheet contains examples, explanations, and six...
Curated OER
Building Understanding of Rate of Change/Slopes Using Alice
Young scholars explore slope as a rate of change. In this eighth grade mathematics lesson, students investigate real-world problems to determine rate of change and transform it into a linear representation, thus determining slope. Young...
Curated OER
Exploration 1: Instantaneous Rate of Change Function
In this function worksheet, learners read word problems and write functions. They determine the instantaneous rate of change and identify intervals. This three-page worksheet contains approximately 20 problems.
Curated OER
Rate of Change 1
In this rate of change worksheet, pupils use functions to determine the velocity of an object. This two-page worksheet contains ten problems.
Curated OER
Rate of Change
Students observe and calculate slopes. In this algebra lesson, students graph equations and determine the pace at which the slope is changing. They use the navigator to see the change as they graph the lines around.
Curated OER
Polly and the Shapeshifter
Students analyze the patterns in polygons and relate it to the rate of change. In this algebra lesson, students discuss the relationship between the data and the graph of the data.
Curated OER
Rate of Change Graphically
Students calculate the rate of change. In this algebra lesson, students identify the slope and discuss the different properties of lines as they relate to rate. A discuss doubling time, zero slope and being in two places at once.
Curated OER
Mini Examination #2 - Limits and Derivatives
In this limits and derivatives activity, students solve 18 multiple choice and short answer questions. Students find the limits and derivatives of functions.


