Curated OER
Using Tables
In this using tables learning exercise, 9th graders solve and complete 10 various types of problems that include using tables to determine information. First, they write an equation to determine the total amount. Then, students define...
Curated OER
Drawing Plans to Scale
For this drawing plans to scale worksheet, students examine how to convert small scale drawings to real life plans. They work with perimeters and areas when given the scale ratio. They complete 7 multi-step questions. They enter the...
Curated OER
Grid Skills
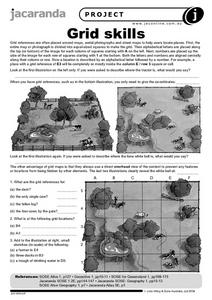
In this geography activity, students use grid references on a map to locate places in the pictures given. They also identify another advantage of using a grid map, which they have an overhead view of the content to prevent any features...
Curated OER
Making It Balance
Students listen to story, "The 100-Pound Problem," compare their weight with character in story, and weigh different classroom items using nonstandard units and standard units. They experiment with different items that can make scale...
Curated OER
Raising the Bar While Hogging the Ham (Radio, That Is)
Young scholars watch a Cyberchase video to determine the importance of using the correct scale when making bar graphs. They examine how to use bar graphs to gain information easily. They determine how to use bar graphs persuasively.
Curated OER
Three D Constellations
Students address a major misconception in astronomy, the understanding of scale. The lesson is designed to introduce students to both celestial coordinates and to the first rung on the distance determination ladder, parallax.
Curated OER
Build an Approximate Scale Model of an Object
Young scholars create a model of an object of their choice using sketches that they have drawn. They study what a scale model is and how to construct one. They examine the uses for scale models and why they are produced.
Curated OER
MAPS AND TOPOGRAPHY
Students analyze the details of a topographic map and create one of their own by utilyzing a map of elevations.
Curated OER
Scale Model of Our Nearest Stars
Sixth graders calculate a light day, light hour, and light minute from the standard of a light year. After establishing the distances, a one meter scale is created to demonstrate the distance between the sun and the planets of our solar...
Curated OER
Make a Classroom Map
Students map the items in their classroom to explain the importance of coordinate systems.
Curated OER
Map Scale
Third and fourth graders are introduced to the concept of map scale. Using an illustration, they discuss if it shows the actual size of the object and why scale is used to represent areas. They use some items in the illustration to...
Curated OER
Mapping It Out
This PowerPoint provides information about maps. Students discover the functions of legends, compasses, indexes, and scales on maps. Two resources links are provided, however one of them is broken.
Curated OER
Community Building
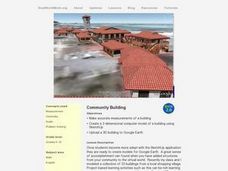
Pupils build different shapes using sketches. In this geometry lesson, students explore measurements and units as they build and create models of buildings. They use SketchUp to create and manipulate shapes.
Curated OER
Ratio Relationships
Students solve for the different ratio and proportion of a problem. For this geometry lesson, students show their knowledge of how to solve proportional relationships. They convert between percent, decimals and fractions.
Pennsylvania Department of Education
The Weight of Things
Students explore weight. In this math lesson plan, students predict which item weighs more and discuss how they arrived at their decision. Students weigh several items to determine which weighs more.
Curated OER
Measure Up!
Young scholars examine parallax and angular measurements. For this investigative lesson students calculate distances of objects and map their results.
Curated OER
How Does a Spring Scale Work?
Students create visuals of the effect of a spring scale. In this algebra lesson plan, students use the navigator to graph the effects created by a spring scale. They draw conclusion from the graph.
Curated OER
Levers in the Body: They Are Not What You Might Think!
Students investigate lever systems in the human body and compare arm anatomy to model. In this human levers lesson students graph and analyze their results.
Curated OER
Tour of the World
In this tour of the world puzzle, students read a map and determine a travel itinerary based upon given criteria. They are required to visit 23 cities. This one-page worksheet contains one puzzle. The answer is provided at the bottom...
Curated OER
Learning to Use a Scale
In this scale worksheet, students measure items on a scale, and read examples. Students complete 4 questions on their own about scale measurement.
Curated OER
Designed to Scale
Seventh graders study ratios, scale and distances according to a three dimensional model. In this exploratory lesson students create their own constellation and prepare an oral presentation that describes their model.
Curated OER
Designed to Scale
Seventh graders construct a three dimensional model of a constellation. In this constellation lesson, 7th graders make a blueprint for a scale model of the constellation and create their models. They present their models to the class.
Curated OER
Any Nook or Cranny
Students create a reading nook. In this measurement lesson, students find a spot in the classroom to turn into a reading nook. They need to measure how much space they need to fit students and supplies into their nook.
Curated OER
What do Maps Show?
Eighth graders practice the skill of reading maps. In this geography instructional activity, 8th graders participate in a classroom lecture on how to read a map.


