Texas Instruments
Texas Instruments: Numb3 Rs: Dialing Ben
Based off of the hit television show NUMB3RS, this lesson has students try to discover if there has been a significant change in cell phone use over the course of ten days. If so, this "change point" can be detected by creating a line of...
Texas Instruments
Texas Instruments: Mc Dougal Littell Middle School Math: Making Data Displays
Students will create data displays using a scatter plot and a line graph of the data and a circle graph of survey data.
Illustrative Mathematics
Illustrative Mathematics: 8.sp Us Airports, Assessment Variation
The scatter plot below shows the relationship between the number of airports in a state and the population of that state according to the 2010 Census. Each dot represents a single state. Students will explore the relationship between the...
Mangahigh
Mangahigh: Data: Scatter Plots
This site provides students practice with the concept of scatter plots. Students can learn about the topic by completing an interactive tutorial. Students can then take a ten question timed test to practice the skill.
CK-12 Foundation
Ck 12: Statistics: Scatter Plots Grades 9 10
[Free Registration/Login may be required to access all resource tools.] Use real-world data to make a visual display using scatter plots.
CK-12 Foundation
Ck 12: Statistics: Scatter Plots Grade 7
[Free Registration/Login may be required to access all resource tools.] Use real-world data to make a visual display using scatter plots.
CK-12 Foundation
Ck 12: Algebra: Fitting Lines to Data
[Free Registration/Login may be required to access all resource tools.] Make a scatter plot of data and find the line of best fit to represent that data.
Khan Academy
Khan Academy: Estimating Slope of Line of Best Fit
Given a scatter plot, can you estimate the slope of the line of best fit that goes through the data points? Students receive immediate feedback and have the opportunity to try questions repeatedly, watch a video, or receive hints.
Other
Sky Mark: Scatter Plots
This page gives a description of scatter plots along with examples. Also provides explanations and statistics to aid student understanding.
ClassFlow
Class Flow: Data Analysis Using Graphing
[Free Registration/Login Required] This flipchart allows students to analyze data using appropriate graphs, including pictographs, histograms, bar graphs, line graphs, circle graphs, and line plots introduced earlier, and using...
Khan Academy
Khan Academy: Fitting Quadratic and Exponential Functions to Scatter Plots
Determine if a quadratic or exponential model fits a data set better, then use the model to make a prediction. Students receive immediate feedback and have the opportunity to try questions repeatedly, watch a video or receive hints.
Khan Academy
Khan Academy: Review: Clusters in Scatter Plots
An article that discusses what we mean when we talk about clusters in scatter plots. It also includes practice questions that test your knowledge of the topic.
Khan Academy
Khan Academy: Review: Outliers in Scatter Plots
Learn about the points that don't fit the pattern in a scatter plot with this article. Site also includes practice questions to test your knowledge of the topic.
CK-12 Foundation
Ck 12: Algebra: Factoring When the Leading Coefficient Equals 1
[Free Registration/Login may be required to access all resource tools.] This lesson covers factoring quadratics when the leading coefficient is 1.
Annenberg Foundation
Annenberg Learner: Against All Odds: Describing Relationships
Video program showing how to use a scatter plot to illustrate relationship between response and explanatory variables, to determine patterns in variables, and to calculate least squares. Real-life examples -- manatee deaths per number of...
Oswego City School District
Regents Exam Prep Center: Categorizing Data
Three lessons on different types of data (qualitative, quantitative, univariate, bivariate, biased data) as well as a practice activity and teacher resource.
University of Regina (Canada)
University of Regina: Math Central: Scatter Plots
Three different concepts are examined about scatter plots. Topics featured are collecting data, analyzing scatter plots, and determining a line of "best fit". The lesson has an overview, material, procedures, and evaluation techniques.
McGraw Hill
Glencoe Mathematics: Online Study Tools: Scatter Plots
This site gives a short interactive quiz which allows students to self-assess their understanding of the concept of scatter plots.
CK-12 Foundation
Ck 12: Algebra: Applications of Function Models
[Free Registration/Login may be required to access all resource tools.] In this lesson students draw a scatter plot of data, find and draw the function that best fits that data, and make predictions from that information. Students watch...
Rice University
Hyper Stat Online Statistics Textbook: Chapter 3: Describing Bivariate Data
This chapter of an online textbook begins with a description of scatterplots, then focuses on the Pearson Product Moment Correlation.
National Council of Teachers of Mathematics
The Math Forum: Nctm: Ask Dr. Math: Stem and Leaf and Scatter Plots
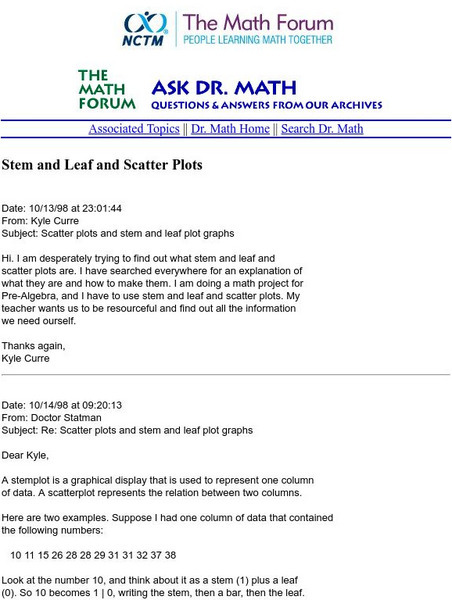
This site is a question/response page which focuses on stem-and-leaf representation and how to construct scatter plots. Dr. Math works through an example and gives commentary notes. Site also contains links for more help.
Khan Academy
Khan Academy: Estimating Equations of Lines of Best Fit and Making Predictions
Practice estimating the equation of a line of best fit through data points in a scatter plot. Then use the equation to make a prediction. Students receive immediate feedback and have the opportunity to try questions repeatedly, watch a...
Texas Instruments
Texas Instruments: Boat Registration and Manatee Deaths in Florida
Students will explore the data on boat registrations and manatee deaths in Florida. They will use the data, the graph of the data and the line of best fit to make predictions about the relationship of the data.
Khan Academy
Khan Academy: Describing Trends in Scatter Plots
Practice making sense of trends in scatter plots. That is, explain what trends mean in terms of real-world quantities. Students receive immediate feedback and have the opportunity to try questions repeatedly, watch a video, or receive...


