Everyday Mathematics
Mathematics Within: Slope and Triangles
Learners discover a method for determining the slope of a line by creating and comparing similar triangles. They fold coordinate grids to make three similar triangles then measure the sides to compare the relationships between the...
Curated OER
Algebra I: Linear Functions
Using rates from a rental car company, young mathematicians graph data, explore linear relationships, and discuss the role of slope and the y-intercept. This activity allows for the discussion of independent and dependent variables, as...
Curated OER
Y-Intercept and Slope Intercept Form
Alegebra amateurs identify the slope and the y-intercept given a linear equation in slope-intercept form by correctly completing some in class problems. They write the linear equation in slope-intercept form that corresponds to the given...
Curated OER
Mathematical Modeling
Study various types of mathematical models in this math lesson. Learners calculate the slope to determine the risk in a situation described. They respond to a number of questions and analyze their statistical data. Then, they determine...
Curated OER
Linear and Quadratic Model, Data Modeling
Students model quadratic and linear equations. In this algebra lesson, students solve word problems using equations. They create scatter plots and make predictions using correlations.
Curated OER
Graphing Equivalent Fractions
Learners graph families of equivalent fractions and compare them by observing the slope of the line formed by each fraction family. They place fractions in ascending order by comparing the slopes of each line after several families of...
Curated OER
Slope-Intercept Form of a Line
Using the subscriber website Explorelearning.com, young mathematicians observe changes in the slope and y-intercept and their effect on the graph of lines. This activity helps students develop an intuitive sense of the connection between...
Curated OER
Academic Grade 9 Assessment of Mathematics: Algebra I and Geometry
Test your class, or use this 12 page math packet as chapter review. They solve 21 multiple choice problems which require them to graph linear equations, find the volume of prisms and cones, find unknown angles, and determine...
Curated OER
Math - Blank Jeopardy
Double Jeopardy! Review polynomials, statistics, triangles, graphing, mode, median, mean, measurement, slope, distance, and ratio. Note: Have everyone use a white board to do the problems to get a quick check on understanding.
Curated OER
Skate Party
Learners use the Frayer model during problem solving. In this problem solving lesson, they examine multiple methods of data collection to solve real world problems. Resources are provided.
Curated OER
Exploring Slope
In this exploring slope worksheet, learners solve and complete 4 different problems. First, they compare an object's weight on Earth to an object's weight on another planet using the information given. Then, students compare this...
Curated OER
Writing Equations of Lines Using The Point-Slope Form
In this writing equations worksheet, students find the equation of a line containing specified points. They determine the slope of a line from given points. This two-page worksheet contains 20 problems. Examples and explanations are...
Curated OER
Slope of a Line
In this slope of a line worksheet, students solve and graph 2 different problems that include determining the slope of a line using the equation y=mx+b. First, they define the slope of a line and the y-intercept. Then, students use the...
Curated OER
A Day at the Beach
Help learners determine the rate of change for the temperature of sand. They will collect data on the temperature of wet and dry sand over time with a heat lamp overhead. Then make a scatter plot of the data and find a linear model to...
Curated OER
Cups & Chips - Solving Linear Equations Using Manipulatives
Algebra students use manipulatives to solve linear equations. They use manipulatives, symbolic methods, and substitution to demonstrate each algebraic solution.
Curated OER
Who Shares My Function? - Linear with Negative and Fractional Slope
Students investigate linear functions with negative and fractional slopes. In this linear functions with negative and fractional slopes lesson, students match a linear equation or chart of values with the corresponding graph. ...
Curated OER
Slope
A nicely put together basic introduction to slope. Slope is defined, and explained. The formula for calculating slope is shown and there are practice problems. There are questions about horizontal and vertical slope, as well as...
Curated OER
Data
Students collect data from an experiment they perform. In this data lesson, students use multiple representations to solve practical problems; describe advantages and disadvantages of the use of each representation. Then, they evaluate...
Curated OER
Density of a Paper Clip Lab Review
Even though this assignment is brought to you by Physics Lab Online, it is best used as a math practice. Middle schoolers calculate the range, mean, mode, and median for a list of eight different paper clip densities. They analyze...
Curated OER
Slope, Intercepts, and Graphing a Line
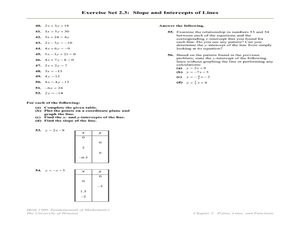
In this intercepts and slope worksheet, students find the slope and/or the x and y-intercepts in fifty-three problems. Students also graph lines using the x and y-intercepts.
Curated OER
Equation of a Line
In this equation of a line worksheet, learners write the equation of a line given two points on the line or the slope and y-intercept. This two-page worksheet contains four equations.
Curated OER
Worksheet 24 - Derivative
In this derivative worksheet, students identify second derivatives and find the directional derivative of a function. They also list the extremes and saddle points of a function. This one-page worksheet contains seven multi-step problems.
Curated OER
Is there Treasure in Trash?
More people, more garbage! Young environmentalists graph population growth against the amount of garbage generated per year and find a linear model that best fits the data. This is an older resource that could benefit from more recent...
Curated OER
Graphing Linear Equations Cards
OK, so maybe graphing linear equations can be fun. This activity includes a set of linear equation cards to be cut and place face up on a table. Learners pick a card and match it to the correct graph card. This is a really fun way to...


