Curated OER
Class Birthday Graph
Young scholars analyze the basics of an Excel spreadsheet. They highlight cells in a spreadsheet. They make a column graph. Students are introduced to X-axis and Y-axis. They play various address games on the spreadsheet.
Curated OER
What's the Scoop?: Our Favourite Ice Cream Flavours
Sixth graders create a spreadsheet on the favorite ice cream flavors of their peers. They interview their classmates, documenting their findings on a "Favorite Flavors" spreadsheet. Students graph and analyze the data.
Curated OER
M&M Graphing
Fourth graders name colors of M&Ms and record answers. They estimate number of M&Ms of each color found in a typical package of M&Ms on piece of paper.They record information on sheet of paper and create a spreadsheet. paper.
Curated OER
European Elevation Sort
Given a prepared database of European countries, sixth graders sort the countries in ascending order by elevation and identify the five countries with the highest elevations. This cross-curricular lesson combines elements of computer...
Curated OER
Metrically Me!
Students define the parts of a database, search strategies to locate information electronically, create/modify databases, etc. and enter data into a prepared spreadsheet to perform calculations.
Curated OER
Cross Cultural Transportation and Resources Exchange
Students examine various modes of transportation. They explore regional transportation options and discover options available in their area. Students survey types of transportation people use in their area. Using spreadsheet data,...
Curated OER
Pancake Breakfast Plans
In this pancake breakfast planning worksheet, 5th graders solve and complete 9 different problems that include completing a chart for a pancake breakfast. First, they set up a spreadsheet to help them plan the event. Then, students...
Curated OER
Writing Fables
Students write their own fables. For this writing fables lesson, students use handheld computers to write a fable. The class designs a spreadsheet to organize common elements of fables. Students also edit each others' work.
American Institutes for Research
Digital Smiles
Explore metric measurement, recording data, and creating an electronic spreadsheet displaying results with your math class. Scholars will measure the length of their smiles, record the measurements, and represent the results on an...
Curated OER
Country Comparisons in Current Events Class
Pupils collect political, socioeconomic, geographical, and other data about 10 countries and record their data in a spreadsheet. The information is used to fuel current events discussions.
Curated OER
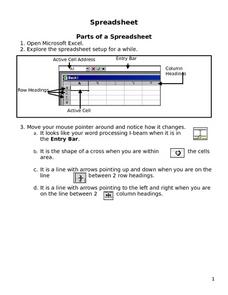
Parts of a Spreadsheet
Pupils create their own spreadsheet. They identify the different parts that make up a spreadsheet and organize their data. They practice using functions and formats.
Curated OER
Graphing My Path to Success
Seventh graders examine their school performance through self-assessment of strengths and weaknesses. They construct a line graph, plotting all courses and achievements. Students use graph paper and colored pencils for each activity. If...
Curated OER
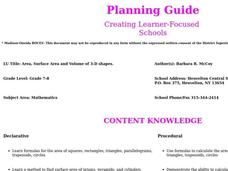
Area, Surface Area and Volume of 3-D Shapes
Math whizzes examine the relationship between area and volume and the relationship between a 3-D shape and its surface area. Following discussion and practice, pupils participate in a project in which they design packaging for a new...
Curated OER
Bungee Jump Lab
Student apply linear relationships to the real world. They use Ken and Barbie dolls and experiment to find the line of best fit. They collect data, analyze data, and make predictions from it. The students also use Microsoft Power Point...
Curated OER
WebQuest: Thrills and Spills- Pick Your Park!
Young scholars participate in a WebQuest in which they must determine which amusement park is the "median priced" park. Students visit park websites to accumulate prices for parking, activities, restaurants, and gift shops.
Curated OER
Credit Cards: The Good, the Bad, and the ugly
Young scholars study how dangerous credit cards can be. They see why it is important to pay off credit card bills as soon as they can. They use MS Excel to display and understand the data. They fill out questions using the data from...
Curated OER
Doughnuts to $ Database
Fifth graders are selling Krispy Kreme doughnuts to raise money for their overnight camping trip. They use a database to set to keep track of and record additions to their daily sales. Students then follow the step by step directions to...
Curated OER
Graph Frenzy!!
Students brainstorm for a survey question to ask classmates. They survey their classmates. They enter the results into a spreadsheet and create the best graph for the information. They share their graphs with the class.
Curated OER
Graphing Our Marbles
Students collect information pertaining to marble colors found in their bag; then creating a spreadsheet in order to make a chart representing their findings using Microsoft Excel. Students will present their results to small groups.
Curated OER
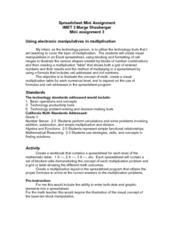
Using Electronic Manipulatives in Multiplication
Factor polynomials using electronic manipulatives. Your class will create a spreadsheet in excel and use it to multiply and perform basic operations and solve problems correctly. They create a visual to go along with each multiplication...
Curated OER
Parts of a Spreadsheet
Students experiment with the basic functions of a spreadsheet. They practice using headers, footers, functions and fonts. They also organize information.
Curated OER
A Line Graph of the Ocean Floor
Students develop a spreadsheet and import the information into a line graph. In this spreadsheet and line graph lesson, students develop a spreadsheet of ocean depths. They import the information into a word processed document. They...
Curated OER
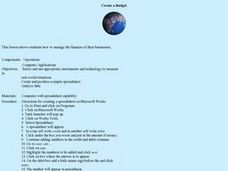
Create a Budget
Students develop a budget spreadsheet to manage finances for their business. In this finance lesson, students use a spreadsheet program to create a budget with credit and debit columns. There are step-by-step directions for...
Curated OER
Creating a Spreadsheet and Graph
Students create graphs in Excel. In this spreadsheet lesson, students input data into spreadsheet cells then use the graphing feature of the Excel program to produce colorful graphs of the data. The directions to create the...


