Curated OER
How is Your Driver Doing?
Sixth graders explore the concept of averaging of numbers and the function of a spreadsheet. Data is collected, analyzed, and displayed in this activity. The NASCAR race results provides the basis for the collection of data.
Curated OER
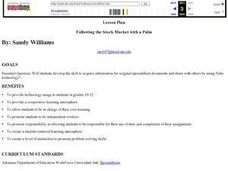
Following the Stock Market With a Palm
Students research and explore the stock market. They research a three-year history of stocks, develop a group and individual spreadsheets, and follow their stocks and prices for a ten-day period, graphing the results.
Curated OER
Graphing Favorite Colors
Third graders collect data and insert it into ClarisWorks to create a spreadsheet/graph of their favorite color. They interpret the data together.
Curated OER
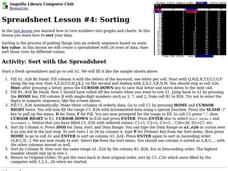
Sorting
Students examine how sorting is the process of putting things into an orderly sequence based on some key value. For this lesson students create a spreadsheet with 26 rows of data, then sort those rows by different values.
Curated OER
Buying My First Car
Students pretend they are about to buy their first new car. They must do all the calculations necessary to estimate the cost of purchasing the car. They see that the math they learn in school really does have real-life applications.
Georgia State University
Georgia State University: Creating Spreadsheets Using Ms Excel
This Georgia State University site gives in outline form the basic principles of using spreadsheet software. At the end of the outlines, specific uses for spreadsheets in recordkeeping are suggested.
Google
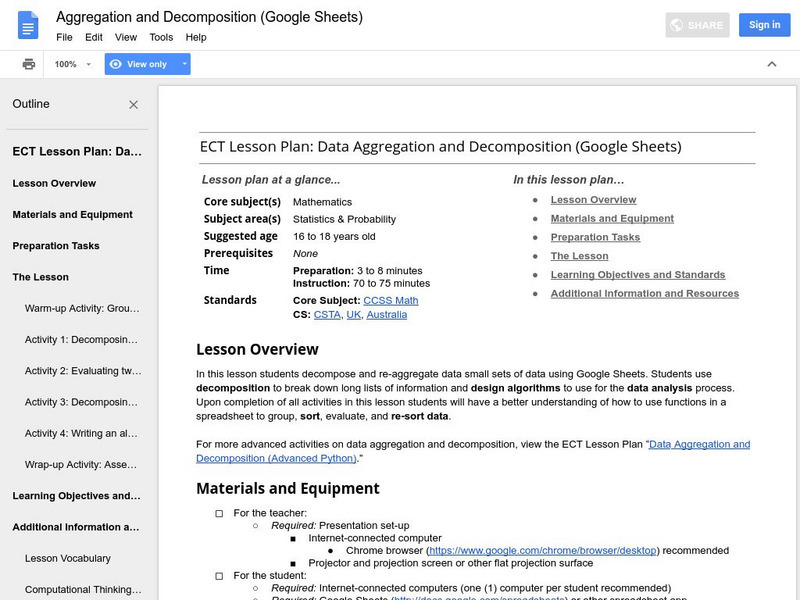
Google for Education: Data Aggregation and Decomposition (Excel)
By using Microsoft Excel, young scholars collect, decompose, and re-aggregate class data. Students use computational thinking skills by decomposing long lists of information and writing basic algorithms to help analyze data.
Google
Google for Education: Sorting Data
In this example students use data collected from their class and learn to sort it before calculating the mean, median, and mode. Additionally, students learn how to use spreadsheet functions to sort based on different criteria, leading...
Google
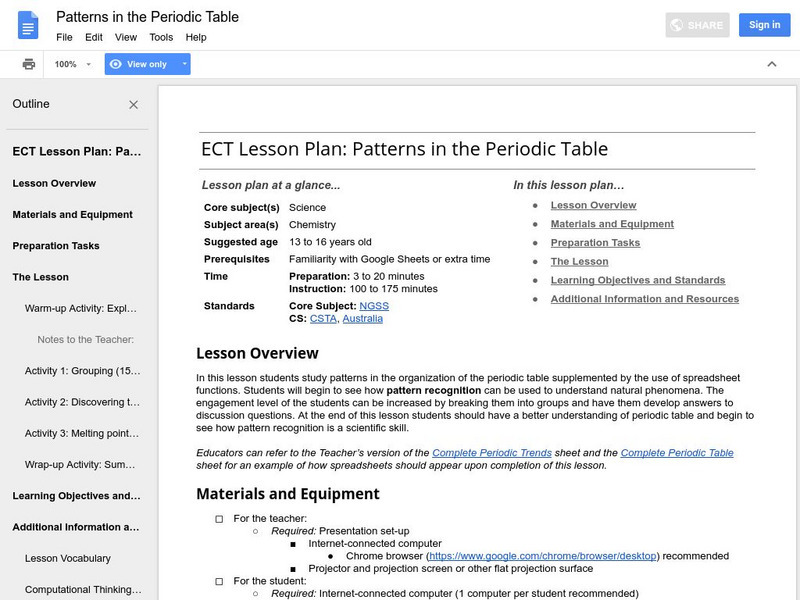
Google for Education: Patterns in the Periodic Table
Students study trends in the periodic table of elements, supplemented by the use of spreadsheet functions. The spreadsheet functions presented can be used on any data set.
Google
Google for Education: Sorting the World's Cities (Excel)
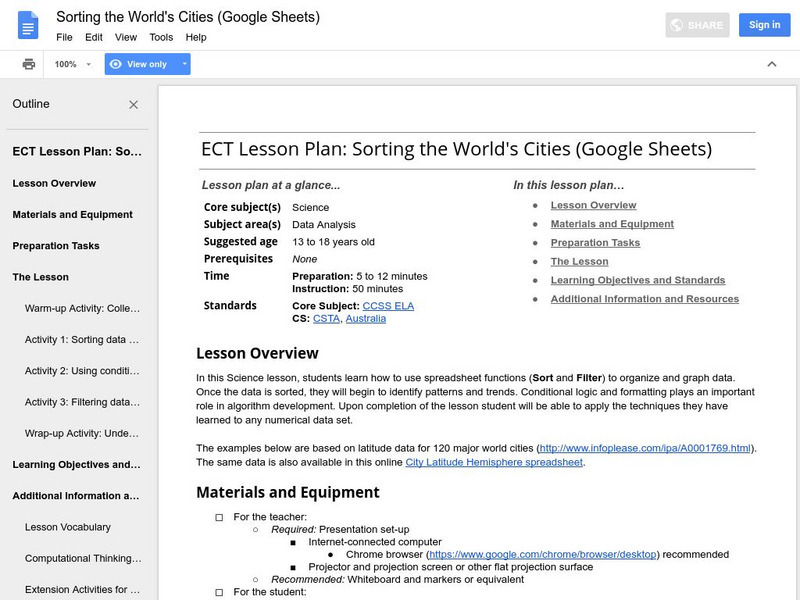
Students learn to organize, sort, and display data in a Microsoft Excel spreadsheet using latitude data for 120 major world cities.
Google
Google for Education: Sorting the World's Cities (Python)
The second of two similar lessons where young scholars learn how a Python program can organize and sort data. When taught in conjunction with Sorting the World's Cities with Excel, students make the connection between writing a program...
Google
Google for Education: Energy Analysis
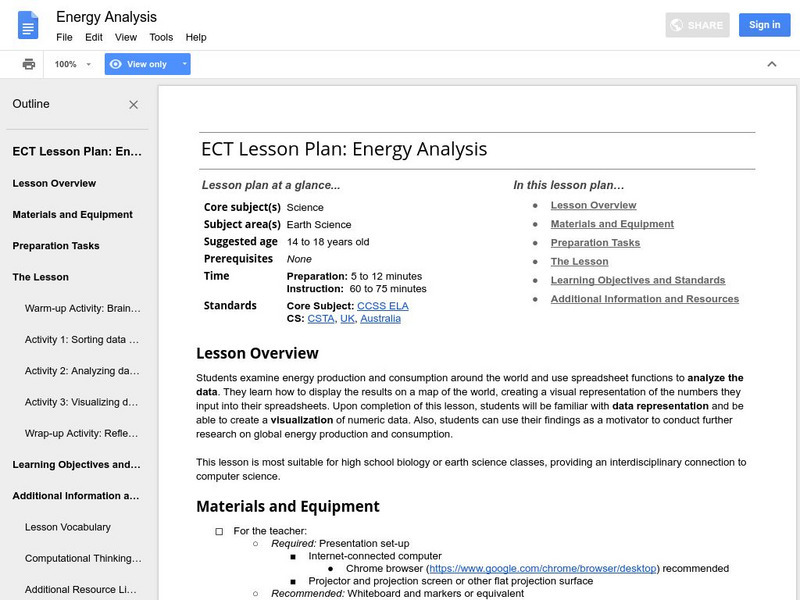
Students collect data on energy production and consumption around the world. They input the data into a spreadsheet and use spreadsheet functions to analyze it. Finally, they upload the data into a fusion table to create a visualization.
Other
Water on the Web
Water on the Web (WOW) is an advanced site allowing students to actively participate in data analysis from real research sites. Lesson plans on a range of topics are provided. There is also a tutorial for using Excel to graph WOW data.
University of Kentucky
Univ. Of Kentucky: Using Excel to Fit a Titration Curve
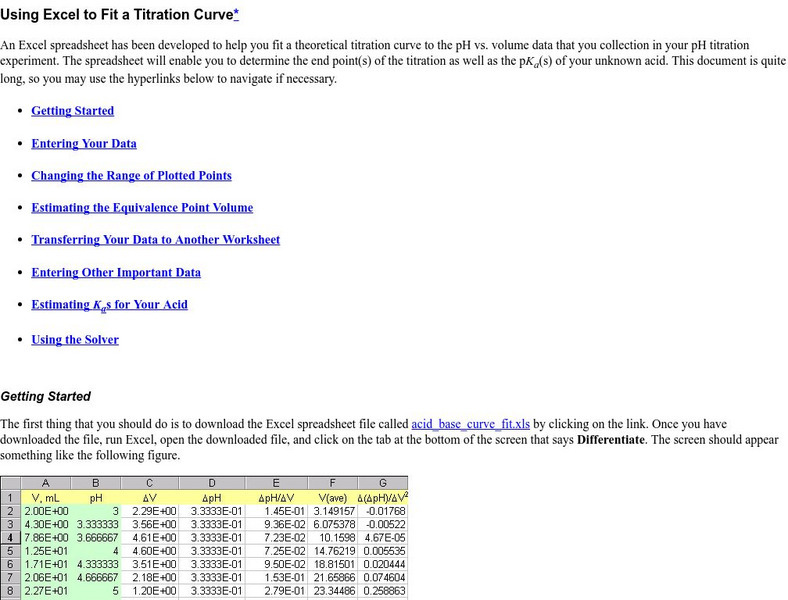
This site from the University of Kentucky provides instructions on using a spreadsheet to plot a best-fit titration curve.
Science Education Resource Center at Carleton College
Serc: The Mole in Chemistry: Determining the Number of Atoms in Everyday Items
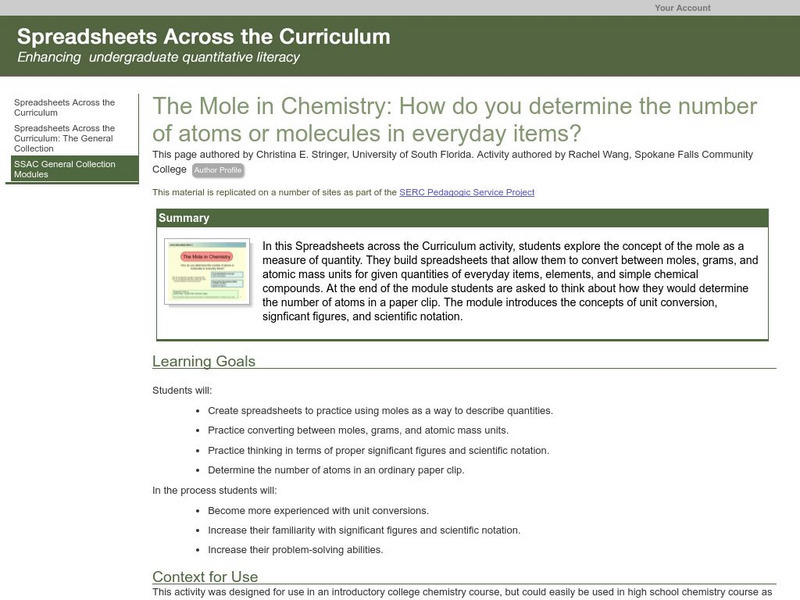
Students explore the concept of the mole as a measure of quantity. They build spreadsheets that allow them to convert between moles, grams, and atomic mass units for given quantities of everyday items, elements, and simple chemical...
Science Education Resource Center at Carleton College
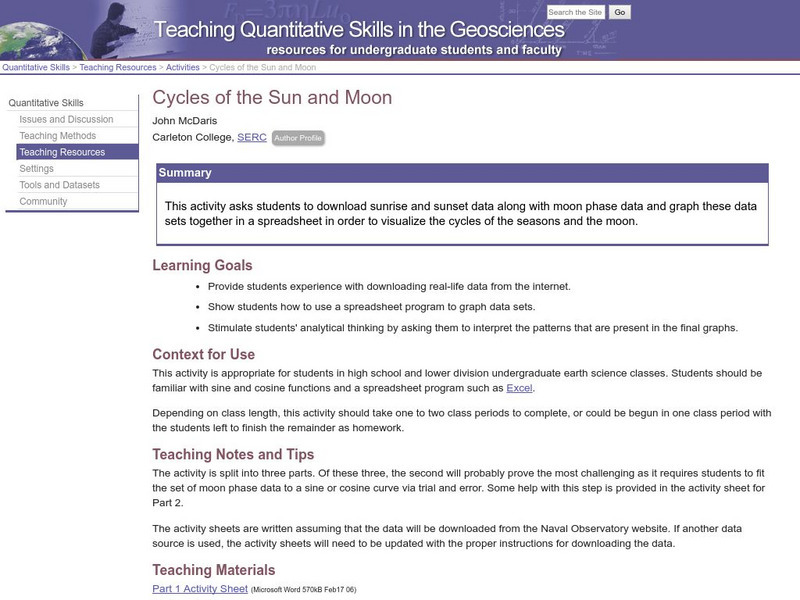
Serc: Cycles of the Sun and Moon
Students download sunrise and sunset data along with moon phase data, and graph these data sets together in a spreadsheet in order to visualize the cycles of the seasons and the moon.
Other
Personal: Let's Go Shopping
This personal site provides a student activity that allows learners to practice spreadsheet skills in inputting data and creating function formulas. The activity is based on the collection and comparison of shopping receipts using max,...
Other
Tonya Skinner Business Ed Lesson Plans: Grocery Shopping
This personal site provides a student activity that allows learners to plan a class party while organizing the budget details in a spreadsheet program. Learners will demonstrate computer skills in inputting data, formatting data, and...
Other
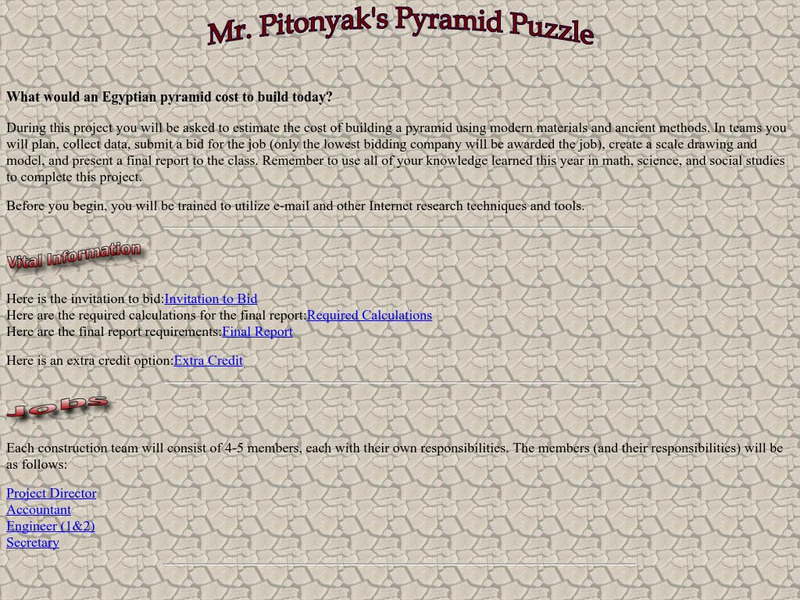
Mr. Pitonyak's Pyramid Puzzle
Students estimate the cost of building an Egyptian pyramid with modern materials and ancient building methods in this math project.
Other
Fast Food Fun
Use your knowledge of spreadsheets to analyze the calories and fat content of fast food choices. This project gives links to a USDA site and a final report format. A sample spreadsheet and grading rubric is also provided.
Apple
Apple Learning Interchange: Classroom Ideas
Do you use Appleworks in your classroom? Would you like some ideas that others have used? This site presents some exemplary lessons from other teachers.
Teachnology
Teachnology: Spreadsheet Guide for Teachers
A Spreadsheet is a wonderful tool with applications well beyond simple calculations. This site provides a collection of lesson plans, tutorials and worksheets that help bring spreadsheets into the classroom.
Other
Think Free Office
ThinkFree allows you to create, view, publish, edit, and share word processing documents, spreadsheets, and presentations, all online. Sign up and have access to all of your documents from anywhere that you have web access. The website...


