University of Texas
Inside Mathematics: Parking Cars [Pdf]
This task challenges a student to use their understanding of scale to read and interpret data in a bar graph.
US Department of Education
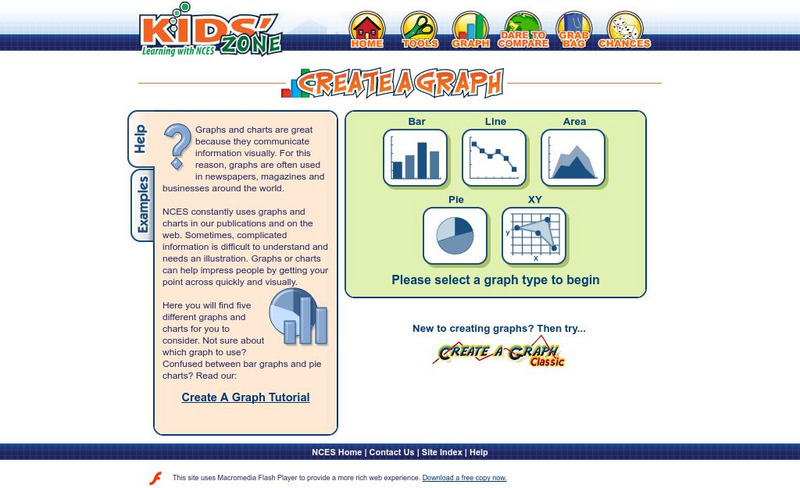
Nces Kids' Zone: Create a Graph
Resource from the National Center for Education Statistics allows you to create great bar graphs. Simply enter your information, choose appropriate colors, and voila!- you have a beautiful graph you can turn put into your report!


![Inside Mathematics: Parking Cars [Pdf] Lesson Plan Inside Mathematics: Parking Cars [Pdf] Lesson Plan](https://d15y2dacu3jp90.cloudfront.net/images/attachment_defaults/resource/large/FPO-knovation.png)
