Curated OER
Can You Count on Cans?
How can a canned food drive be connected to math? It's as simple as counting and organizing the cans! Children demonstrate their ability to sort non-perishable foods into categories that include soup cans, vegetable cans, boxed items,...
Curated OER
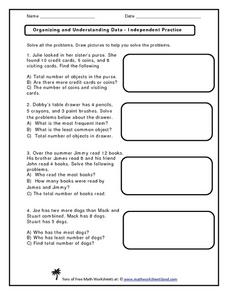
Organizing and Understanding Data - Independent Practice
Provide your first graders with an opportunity for independent practice organizing and understanding data. The ten story prompts on this three-page worksheet asks learners to solve problems involving concepts of the total number of...
University of Texas
Inside Mathematics: Granny's Balloon Trip [Pdf]
This task challenges a student to use knowledge of scale to organize and represent data from a table on a graph.
National Council of Teachers of Mathematics
The Math Forum: Exploring Ocean Data Lesson Plan
Find "oceans of data" for students of all ages. NCTM, California, and Philadelphia standards are listed for each grade level along with lesson plans and other website resources.
University Corporation for Atmospheric Research
Ucar: Project Sky Math
Teachers will be interested to explore the SkyMath module, and the 16 classroom activities at this site. In this program, students will collect and record real-time weather data to analyze. Data analysis, graphing, number relationship,...
Other
Global Grocery List Project: Homepage
At this site from the Global Grocery List Project, students collect data on the prices of common grocery items and submit their findings. They can then compare the data they collected to data from students around the world. There are...
Annenberg Foundation
Annenberg Learner: Drawing a Box Plot
Learn how to represent the Five-Number Summary graphically using a box plot.
Scholastic
Scholastic: Study Jams! Math: Data Analysis: Line Plots
Explore how to organize and plot data on a line plot by going step by step through the activity. Then test your knowledge to check for understanding.
Illustrative Mathematics
Illustrative Mathematics: Favorite Ice Cream Flavor
The purpose of this task is for students to represent and interpret categorical data. As a class, students will answer a question with three possible answers and construct a bar graph with the responses. Multiple discussion questions and...
US Department of Education
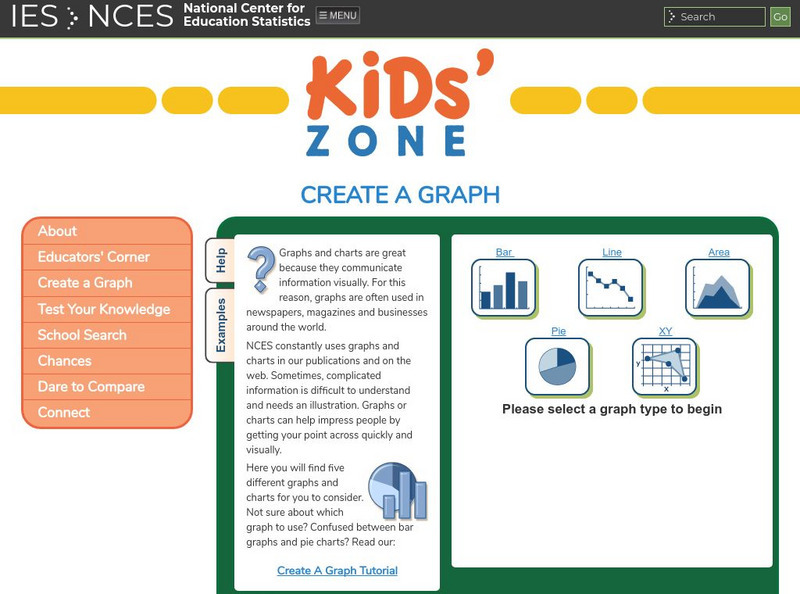
Nces Kids: Create an Xy Graph
This is where you can find a step by step explanation of how to create an XY graph. When you finish each step just click the next tab and you will find the next set of instructions.
BBC
Bbc: Representing Data
This BBC Math Bite tutorial for line graphs, pictograms, and frequency polygons features an exam in which students draw and interpret statistical diagrams.
US Department of Education
National Center for Education Statistics: Nces Classroom
Just what is the NCES Students' Classroom? In addition to many useful features, this site provides math and statistical activities tailored to a middle and elementary school students.
Houghton Mifflin Harcourt
Houghton Mifflin Harcourt: Saxon Activity Center: Real World Investigation: Elevation Changes [Pdf]
Math and geography are the focus of this internet investigation. Learners must plan a road trip to several cities and plot the elevations of those cities using a line graph. Acrobat Reader required.
McGraw Hill
Glencoe: Interpreting Data Quiz
This is a quiz with five quick questions to check your understanding of how to interpret data. It is self checking.
McGraw Hill
Glencoe: Collecting and Analyzing Data Quiz
This site is a quiz with five quick questions to check your understanding of how to collect and analyze data. It is self checking.


![Inside Mathematics: Granny's Balloon Trip [Pdf] Lesson Plan Inside Mathematics: Granny's Balloon Trip [Pdf] Lesson Plan](https://d15y2dacu3jp90.cloudfront.net/images/attachment_defaults/resource/large/FPO-knovation.png)


