Illustrative Mathematics
Velocity vs. Distance
At the end of this activity, your number crunchers will have a better understanding as to how to describe graphs of velocity versus time and distance versus time. It is easy for learners to misinterpret graphs of velocity, so have them...
Illustrative Mathematics
Bike Race
A graph not only tells us who won the bike race, but also what happened during the race. Use this resource to help learners understand graphs. The commentary suggests waiting until the end of the year to introduce this topic, but why...
Texas Education Agency
Texas Gateway: Functions and Their Inverses
Given a functional relationship in a variety of representations (table, graph, mapping diagram, equation, or verbal form), the student will determine the inverse of the function.
Texas Education Agency
Texas Gateway: Domain and Range: Contextual Situations
The student will be able to identify and determine reasonable values for the domain and range from any given contextual situation.
Texas Education Agency
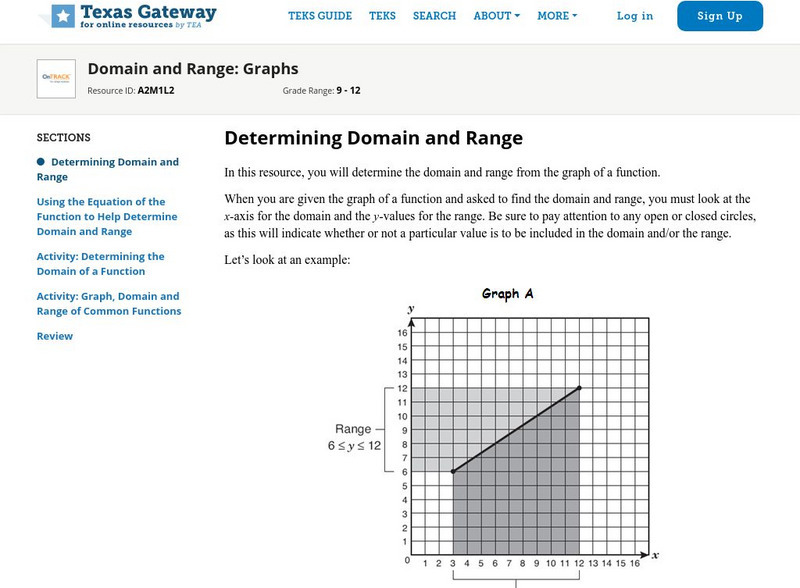
Texas Gateway: Domain and Range: Graphs
Given a function in graph form, identify the domain and range using set notation, interval notation, or a verbal description as appropriate.
Texas Education Agency
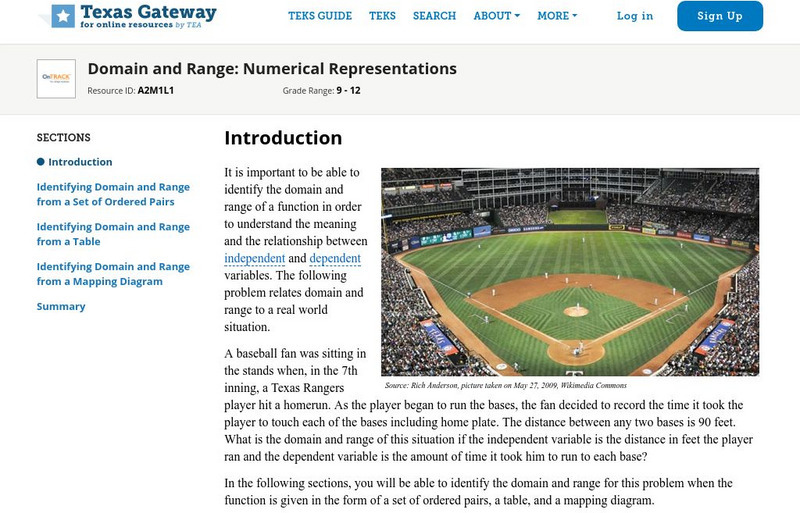
Texas Gateway: Domain and Range: Numerical Representations
Given a function in the form of a table, mapping diagram, and/or set of ordered pairs, the student will identify the domain and range using set notation, interval notation, or a verbal description as appropriate.
Anne Arundel Community College
Anne Arundel Community College: Math 131: Function Notation
The tutorial examines function notation and functional relationships. Students learn about the mathematics concept through examples with detailed solutions.
Texas Education Agency
Texas Gateway: Domain and Range: Verbal Description
The student will be able to identify and determine reasonable values for the domain and range from any given verbal description.
University of Illinois
University of Illinois: Quadratic Formula
This site from the University of Illinois offers an excellent simulation of the quadratic formula, where you can type in different values for a, b, and c, and then view the change in the answer for x.


