Curated OER
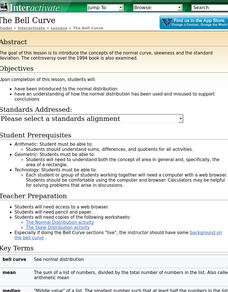
The Bell Curve
Students are introduced to the normal distribution and examine the bell curve controversy.
Curated OER
Statistics: Final Exam Review
For this statistics and probability worksheet, students are provided with a review of the final exam in statistics. The three page worksheet contains a combination of six multiple choice and free response questions. Answers...
Curated OER
Scrabble
In this frequency learning exercise, students use the standard rules for Scrabble to find the abbreviations used on the board. Then, the determine the frequency as stated in the chart shown to represent the correct number of letter tiles.
Curated OER
Measures of Spread
Students explore the concept of measures of spread. For this measures of spread lesson, students calculate the standard deviation for a set of data. Students use the standard deviation to analyze and describe the set of data. Students...
Curated OER
Data Analysis
Students examine techniques to represent data. In this data analysis instructional activity, students read about various ways to represent data, such as a stem and leaf diagram and calculating standard deviation. Students complete data...
Curated OER
Hypothesis Testing: Claim on Mean; Population Standard Deviation Known
In this standard deviation worksheet, students are given statistical data in a story problem. They use a level of significance to test the claim given by the data. This worksheet contains three problems.
Curated OER
Hypothesis Testing: Claim on Mean; Population Standard Deviation Unknown
In this statistics worksheet, students test given claims using traditional methods of hypothesis testing. Students assume that sampling is randomly generated.
Curated OER
A RealSim Surface Look at Descriptive Statistics
Students explore the concepts of mean and variance. They observe properties of materials to their basic atomic or molecular structure. Students use spreadsheet software to record, tabulate and analyze collected information.
Curated OER
Using Computers for Statistical Analysis of Weather
Students use temperature, cloud cover and other weather data from the S'COOL website to statistically analyze weather around the country. They use computers to calculate and graph standard deviations, means and modes of the weather...


