Curated OER
8.SP.1Texting and Grades I
Here is a fitting question for middle schoolers to consider: Is there a relationship between grade point average and frequency of sending texts? Starting statisticians examine a scatter plot and discuss any patterns seen.
Curated OER
Accidents Happen: Seat Belt Laws, Enforcement, and Usage
Start with a NOVA video about car crashes, crash test dummy footage, or other video about seat belt use. Or have groups review attached data about seat belt usage (by state) and share their conclusions. Learners then devise a method to...
Curated OER
Scatter-Brained
Seventh graders graph ordered pairs on a coordinate plane. They create a scatterplot. Additionally, they determine the line of best fit and investigate the slope of the line. Multiple resources are provided. An excellent resource!
Scholastic
Study Jams! Mean/Average
Join Zoe as she calculates the average number of points RJ scored in his basketball games. This step-by-step presentation clearly models the procedure for finding the mean of a data set, including examples with both whole number and...
Scholastic
Study Jams! Median
Zoe is curious how many goals her soccer team usually scores in a game. To answer the question, she walks through the process of finding the median of a data set in this step-by-step presentation. Examples are included that model how to...
Scholastic
Study Jams! Mode
Sam is running for class treasurer and Zoe wants to know if he won the election. Follow along as she counts up the votes and uses the mode to determine the winner. After viewing the presentation, work through the Try It! practice...
Scholastic
Study Jams! Range
Zoe just bought a bunch of CDs and wants to know the range of the prices she paid for them. Follow along and learn how to find the range of a data set by simply subtracting the largest and smallest numbers. Guided and independent...
Yummy Math
Starbucks Drinks
The casual language and popular topic will make this assignment all the more engaging for your middle school math class. They use Starbucks beverage sales and nutrition values to practice ratios, proportions, statistics, and...
Curated OER
Most Likely/Least Likely
Learners consider a practice problem which prompts them to choose the type of marble most likely to be picked out of a group. Then, they answer probability-type questions regarding a spinner, and a tally chart of coins.
Curated OER
Probability
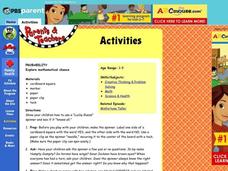
Here is a very clever way of teaching young mathematicians the concept of probability. A spinner is made that has two outcomes, yes and no. A chart is made that has two columns that are labeled Correct and Incorrect. The teacher asks a...
Curated OER
US Energy Geography
The maps display the statistics for energy consumption and power production, state by state. They are tremendous visual aids for your natural resources unit. Consider having your class compare energy consumption versus production, or...
Curated OER
Slanted Surveys And Statistics
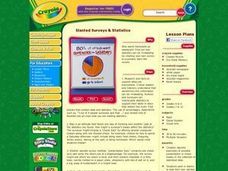
Students engage in a instructional activity that is concerned with the use of statistics and surveys and how they should be read. They create a survey and take it home to collect data. Then students display the data on a graph that is...
Curated OER
Gathering Statistics for Research
Students gather statistics to include in their research. In this statistics lesson, students investigate how to incorporate statistics into research and other readings besides math. They collect data based on other topics, analyze the...
Curated OER
Create a Public Opinion Survey: The Middle East in the News
Though the discrete content here is a pair of New York Times articles about a 1998 military strike on Iraq and the coincident impeachment by the House of Representatives of then-President Clinton, this detailed plan for creating,...
Curated OER
M&Ms Count and Crunch
Students practice skills involving statistics and probability by making predictions on number of each color candy in one pound bag of M&Ms. They record both guesses and actual quantities, calculate percentages, and create bar graphs...
Curated OER
Sampling Bias And the California Recall
Using a 2002 California Gray David recall vote as an example, young statisticians identify sources of bias in samples and find ways of reducing and eliminating sampling bias. They consider ways to select random samples from a...
Curated OER
Starting With Stats
Statisticians analyze a data set of student IQs by finding measures of central tendency and dispersion such as mean, median, mode, and quartiles. They practice using a graphing calculator to find the values and analyze box plots and...
Curated OER
Adventures in Statistics
Here is a fantastic lesson for your fifth grade math scholars. In it, learners must determine if the classrooms of upper graders are bigger, or smaller, than the classrooms of the lower grades. Some excellent worksheets are embedded in...
Curated OER
Yummy Math
Young mathematicians use bags of Skittles to help them gain practice in graphing and organizing data. They work in pairs, and after they have counted and organized their Skittles, they access a computer program which allows them to print...
Curated OER
M&M Graphing
Youngsters sort M & M's by color. They graph the M&M's by color on a graph. This classic lesson is a wonderful way to introduce the concept and technique of graphing to young mathematicians. Pairs of kids can make up their own...
Curated OER
Famous People: Teacher Notes
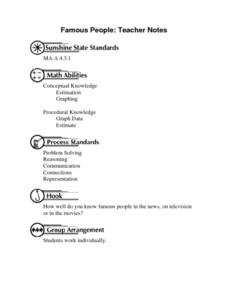
Young statisticians practice creating scatter plots. First, they estimate the age of 14 people. Next, they write down the estimate in a table labeled x. Then write down their actual age in the table labeled y. Using these x and y...
Curated OER
Chances Are......You're Right
Young mathematicians study probability. In this math lesson plan, learners calculate odds, and convert those into percentages of probability. Fractions are also used, making this lesson plan quite rich in some of the more difficult...
Curated OER
Averages: Mean, Median, Mode
After reviewing the process of finding the mean, median, mode, and average of a given data set, learners work through several practice problems. There are five problems related to mode, and five related to finding the mean. Great as...
Curated OER
Did Voters Turn Out -- or Are They Turned Off?
What was the voter turnout at your last state election? Examine voter turnout statistics from the most recent election to learn which ten states have the best turnout record. This lesson offers election data, handouts, and worksheets.


