Curated OER
Worksheet 18: Combinations & Permutations
In this combinations and permutations worksheet, learners list the number of combinations from a given set. They describe and justify the permutations and combinations. This two-page worksheet contains four problems.
Curated OER
Worksheet 16: Plurality
In this plurality worksheet, students study a given set of voting statistical data. They use the plurality method to determine the election results. This two-page worksheet contains four multi-step problems.
Curated OER
Worksheet 14: Condorcet Method
In this Condorcet Method worksheet, students use the Condorcet and Borda Methods to determine the results of given election data. This two-page worksheet contains four multi-step problems.
Curated OER
Worksheet 15: Sequential & Hare Methods
In this Sequential and Hare Method worksheet, students determine the results of elections from given sets of information. They use either the Sequential or Hare Method to determine the outcome. Students justify their answers. This...
Curated OER
Statistics
In this statistics instructional activity, students view 6 graphs to determine the correlation. Students then answer 4 questions that involve plotting data, determining a relationship, and making predictions.
Curated OER
Statistics
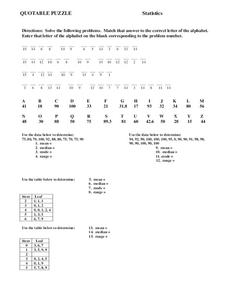
In this statistics worksheet, 8th graders solve and complete 15 different problems. First, they solve each problem by using the data given to determine the mean, median, mode, and range for each set. Then, students match that answer to...
Curated OER
Matrices
In this matrices worksheet, students answer 4 multiple choice questions regarding analyzing matrices and performing operations with matrices.
Curated OER
Statistics
In this statistics worksheet, 8th graders solve and complete 2 multiple choice problems that include determining statistics. First, they determine the equation that best represents the data shown on the scatterplot. Then, students use...
Curated OER
Fruit Loops/Cheerios Activity: Measures of Central Tendency
In this measures of central tendency activity, students use Fruit Loops and Cheerios to gather statistical data. They find the mean, mode and median of the data. Students construct a box-and-whisker plot of the class data. This...
Curated OER
Statistics: Quartiles and Percentiles
In this statistics worksheet, students examine a data set and identify the lower and upper quartiles. They determine percentile ranks of given material and compute the median of the data. This one-page worksheet contains ten problems.
Curated OER
Statistics
In this statistics worksheet, 8th graders solve 4 problem sets related to an introduction to statistics. First, they find the range of each set of data. Then, students find the median and mode of each set of data. In addition, they...
Curated OER
Independent Practice 1: Box and Whisker Plot
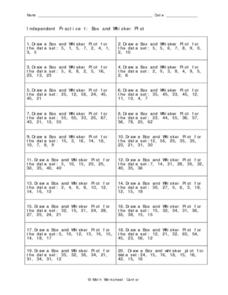
In this box and whisker plot activity, students create a box and whisker plot from a given set of data. They identify the lower quartile, upper quartile, the mean, and outliers. This one-page activity contains 20 sets of numbers from...
Curated OER
Independent Practice 2: Elementary Probability
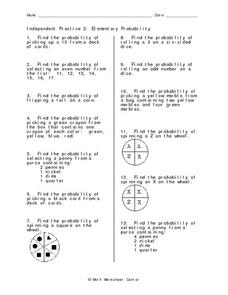
In this probability worksheet, students identify the probability of given events. Problems include topics such as determining the probability of a tossed coin, picking a specified card from a deck of cards, spinning a wheel, and rolling...
Curated OER
Tree Diagrams
In this tree diagram worksheet, students read story problems. From the given information, they draw tree diagrams to determine the total possible number of outcomes. This one-page worksheet contains ten problems.
Curated OER
Creating Frequency Tables
In this frequency table instructional activity, students explore a given set of numbers. They group the data and create a frequency table. This one-page instructional activity contains ten problems.
Curated OER
Reading Histograms
In this histogram worksheet, students read given histograms and answer questions regarding each one. This one-page worksheet contains a total of ten problems.
Curated OER
Quiz: Mutually Exclusive Events, Independent Events, and Complement of an Event
In this statistics learning exercise, students tell the relationship of two events. Students find the complement of given events. They compute the probability of a given event occurring.
Curated OER
Probability and Statistics - Week 10
In this probability and statistics worksheet, students find compound dependent and independent probability of given situations. They identify the mean, mode, range and median of sets. This two-page worksheet contains explanations,...
Curated OER
Linear Regression on TI-86
In this linear regression worksheet, students solve linear regression problems using the TI-86 calculator. Detailed instructions on how to use the calculator are provided. This one-page worksheet contains seven problems.
Curated OER
Linear Regression on TI-85
In this linear regression worksheet, students use TI-85 calculators to complete linear regression expressions. Detailed instructions on the use of the calculator are provided. This one-page worksheet contains seven problems.
Curated OER
Probability and Statistics
In this probability and statistics worksheet, students solve independent and dependent probability problems. They identify the mean, mode and range of a set of numbers. This two-page worksheet contains five probability problems.
Curated OER
Probability
In this math worksheet, students investigate the concept of probability. They read the list for the applications of the concept to the areas of statistics, political science, science, etc...
Curated OER
Mean, Median, and Mode 1
For this mean, median and mode worksheet, students use the measures of central tendency to describe given statistical data. Students identify the range of data, and match data to its representative bar graph. Two multi-step problems...
Curated OER
Line Graphs 4
In this graph worksheet, students interpret given line graphs. They determine the range, and identify the range in a set of data. This one-page worksheet contains approximately 14 problems.


